SPSS Tutorial

This tutorial provides basic and advanced concepts of SPSS. Our SPSS tutorial is designed for beginners and professionals. In this tutorial, we are going to learn how to write proper SPSS. The aim of SPSS is to provide statistical analysis. Our SPSS tutorial includes all topics of SPSS, such as what is SPSS, SPSS Statistics, Parametric Vs. Non-Parametric Stats, SPSS Variables, SPSS Column and Alignment, Scale of Measurement, SPSS Data File Types, SPSS Compute Variable Function, Data transformation, etc.
SPSS Introduction
- In this tutorial, we are going to understand how to run the data analysis technique in SPSS. SPSS stands for statistic package for social science, but the power and capability go beyond social science students. This tutorial gives us a background understanding and deep knowledge of SPSS.
- SPSS develops as a programming language, and it is designed to provide statistical analysis. SPSS is a complex and powerful application which have a graphical and syntactical interface. It is used to provide dozens of functions for managing, analyzing, and presenting data. The statistical capability of SPSS contains a range from simple percentages to complex analyses of the linear models, variances, and multiple regressions. We can range our data from binary variables to logarithmic variables. It provides us an extensive data management functions.
- In this tutorial, we will learn how to write the SPSS program, enter data in SPSS, Data transformation, descriptive statistics, independent sample t-test, creating tables and charts, and exploring several functions for managing our data.
- In this course, we will see everything we need to know about SPSS. The first step of this course actually shows us how to design a questionnaire that suits the SPSS program. After that, we will go a step further into coding our data into SPSS.
- The important part of SPSS is how to choose the right statistical technique in SPSS. We break down the process of choosing the right statistical technique in SPSS by creating a flow chart and a statistical decision tree. Based on the type of question we have, based on the type of variable (Independent variable or dependent variable), and based on the measurement level, we will be able to choose the right test in SPSS. The treatment of data and the choice of the right statistical test depend upon the kind of measure we have taken for the variable.
Prerequisites
Before learning SPSS, you should have basic knowledge of basic computer functionality, basic mathematics, computer language, and logical operators.
Audience
Our SPSS tutorial is designed for beginners and professionals.
Problem
We assure that you will not find any problem in this SPSS Tutorial. But if there is any mistake, please post the problem in the contact form.
Download and Install SPSS
In this section, we are going to download and install IBM SPSS software. This software is available for the free trial from the IBM website for 14 days. So we can download the software and learn it. To download and install the software, we will go to the Google and type 'ibm spss statistics downloads' and then press Enter. Now we will get the following window:
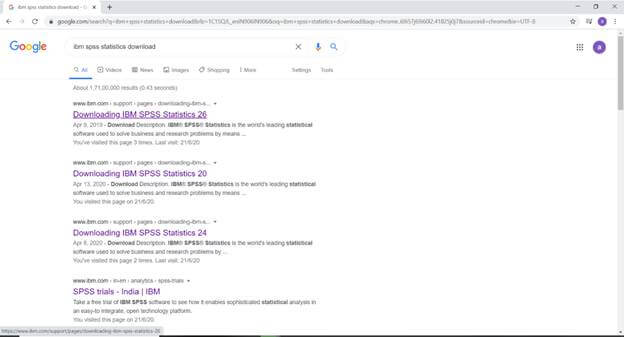
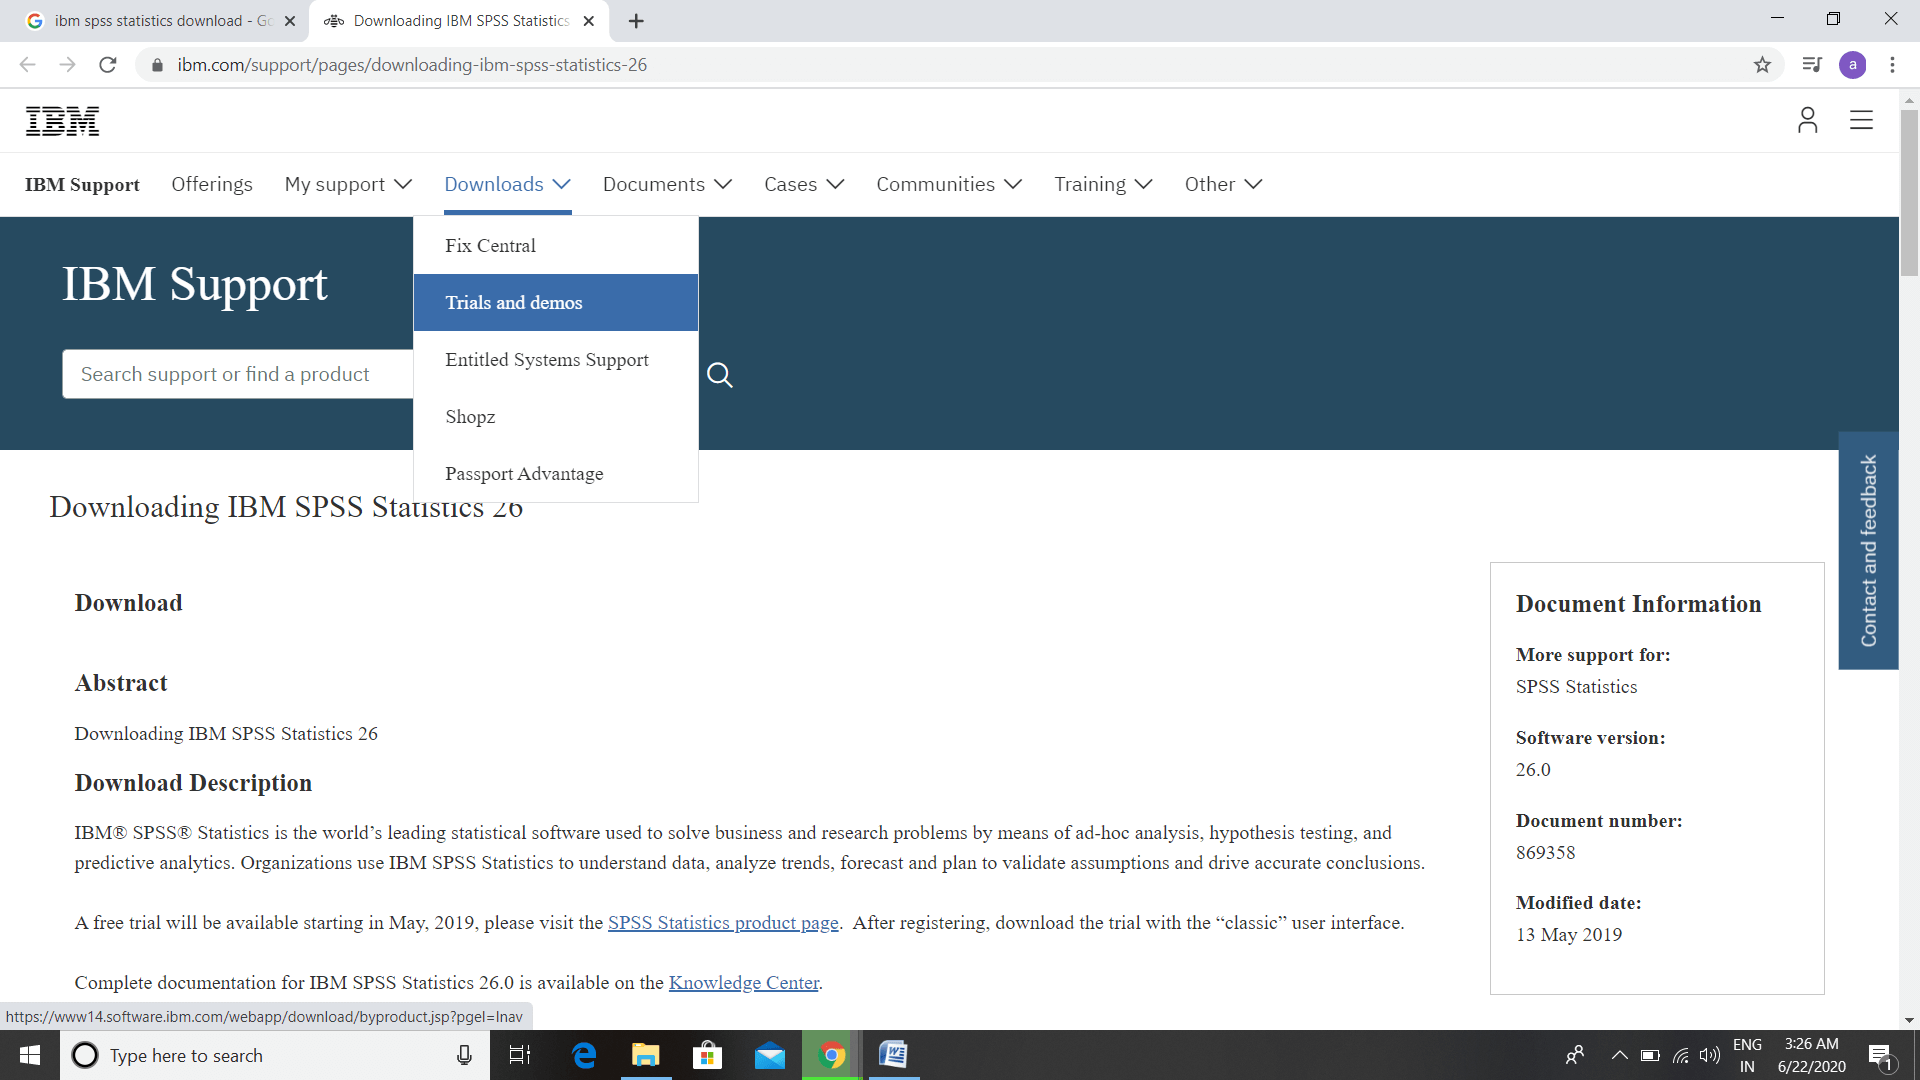
The first link will take us to the download page of IBM, which will give us access to the free trial version. Now we will click on the Downloads and then click on Trials and demos as follows:
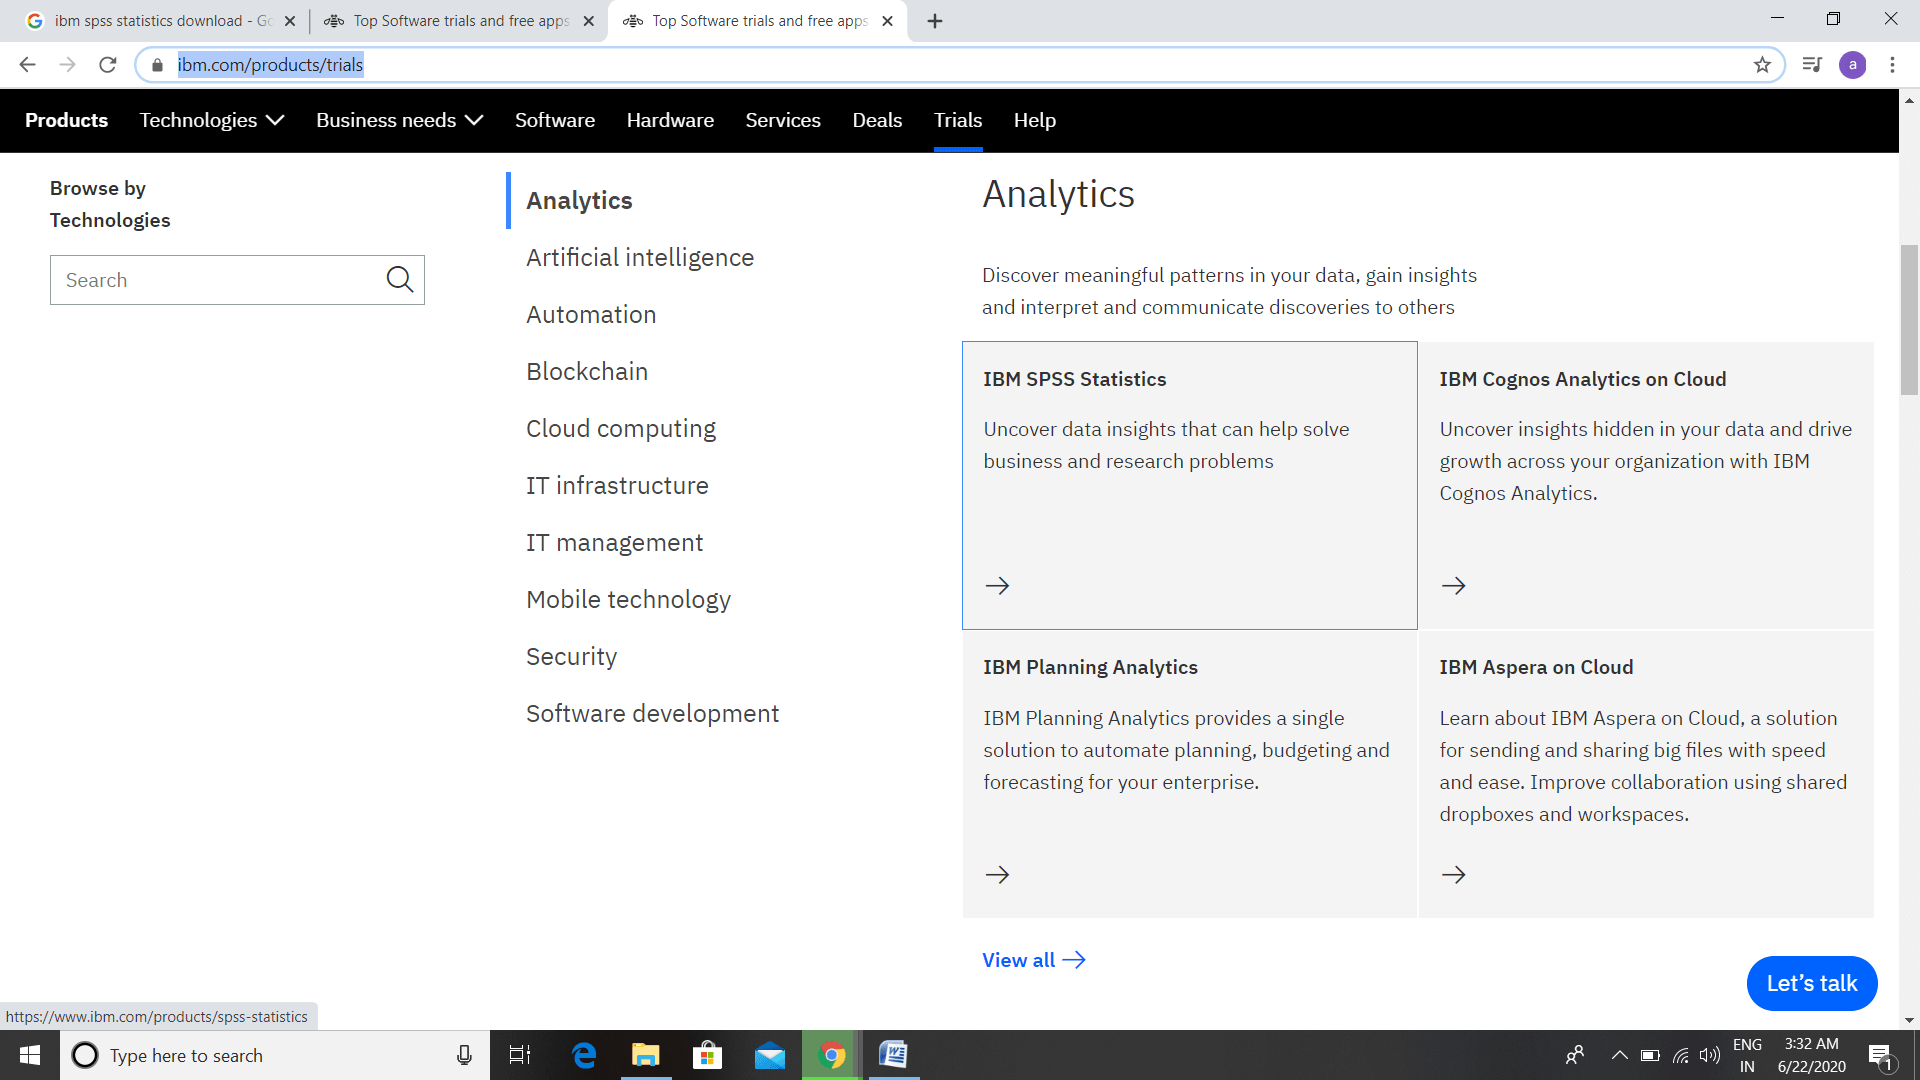
After this, we will get the IBM SASS Statistics option. We can skip the above options and can directly go to this step using the following link https://www.ibm.com/products/trials. Through this link, we will get the IBM SPSS statistics option, as shown below:
After this, we will click on the Try Free for 14 days option, and then we will get the following window:
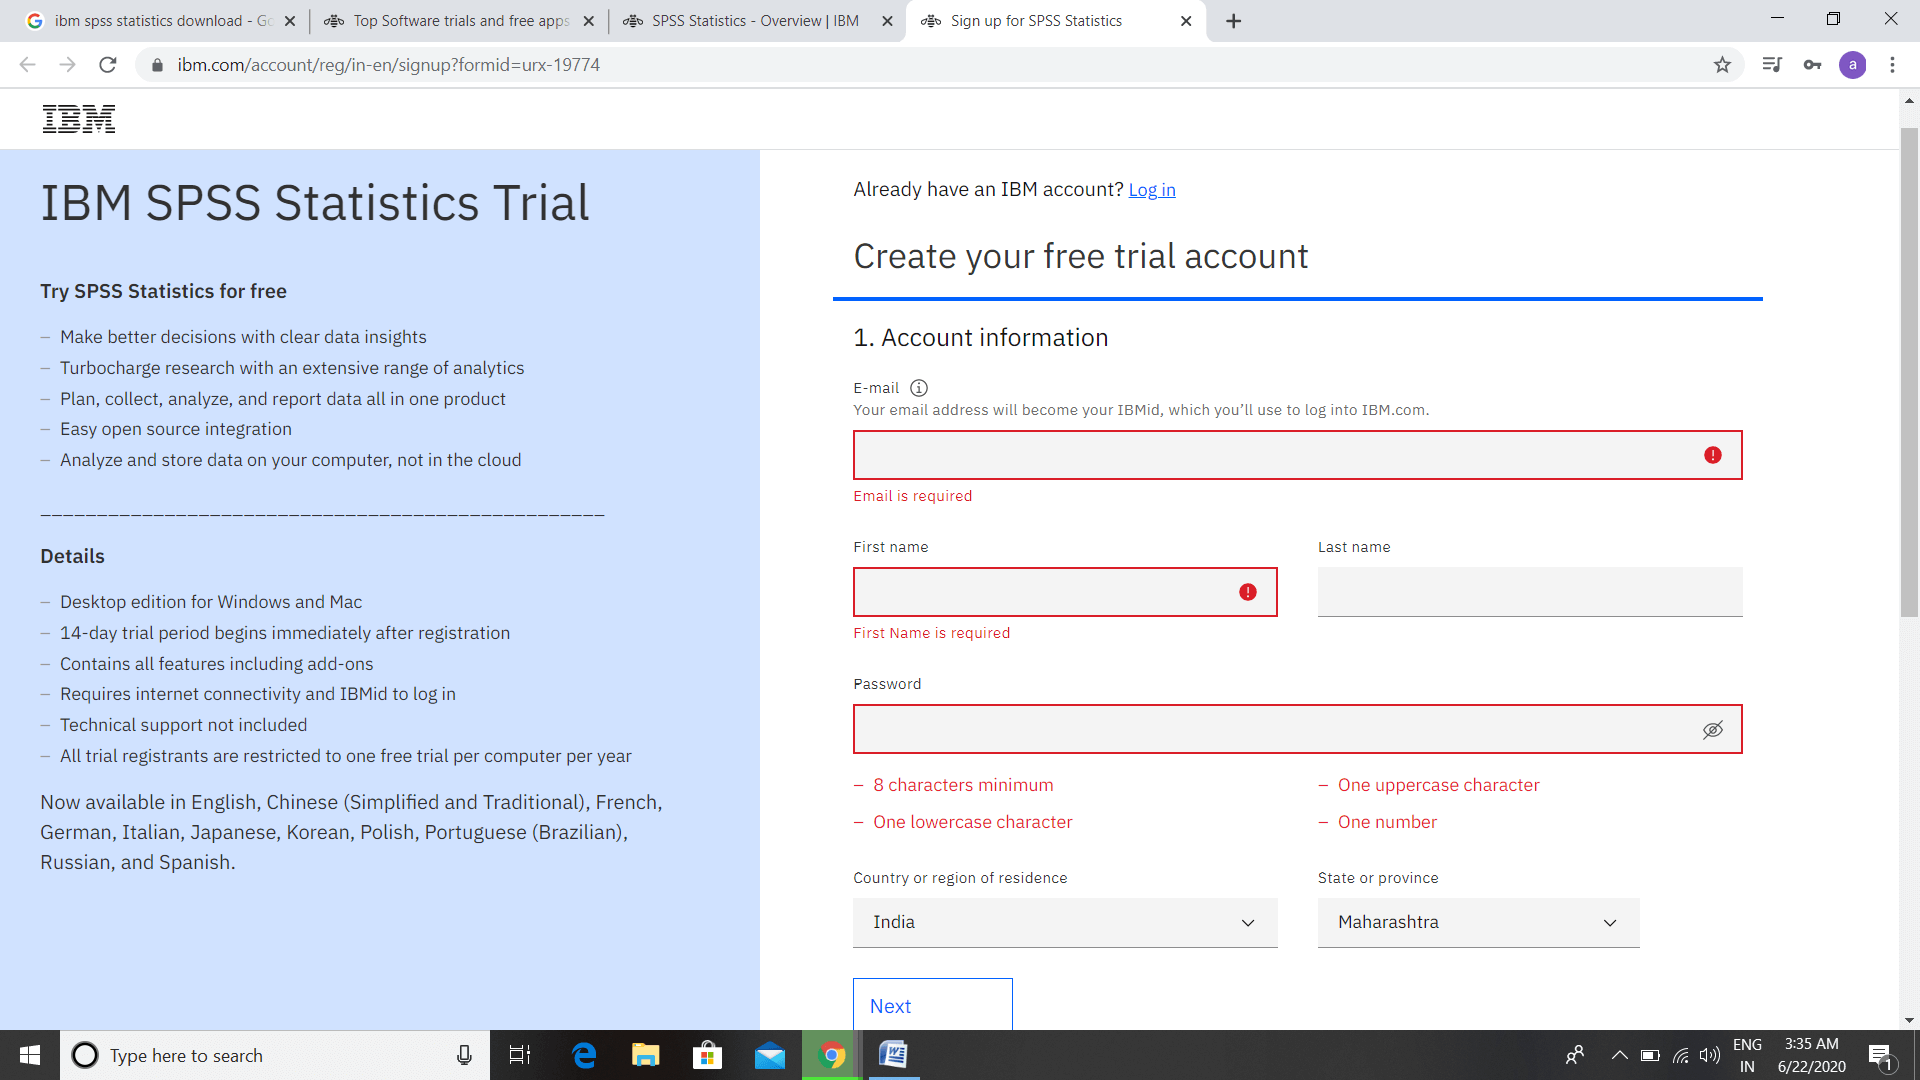
For downloading IBM SPSS software, we have to fill all the required information. After providing all the required information, we will click on Proceed option, and then we will get the following window:
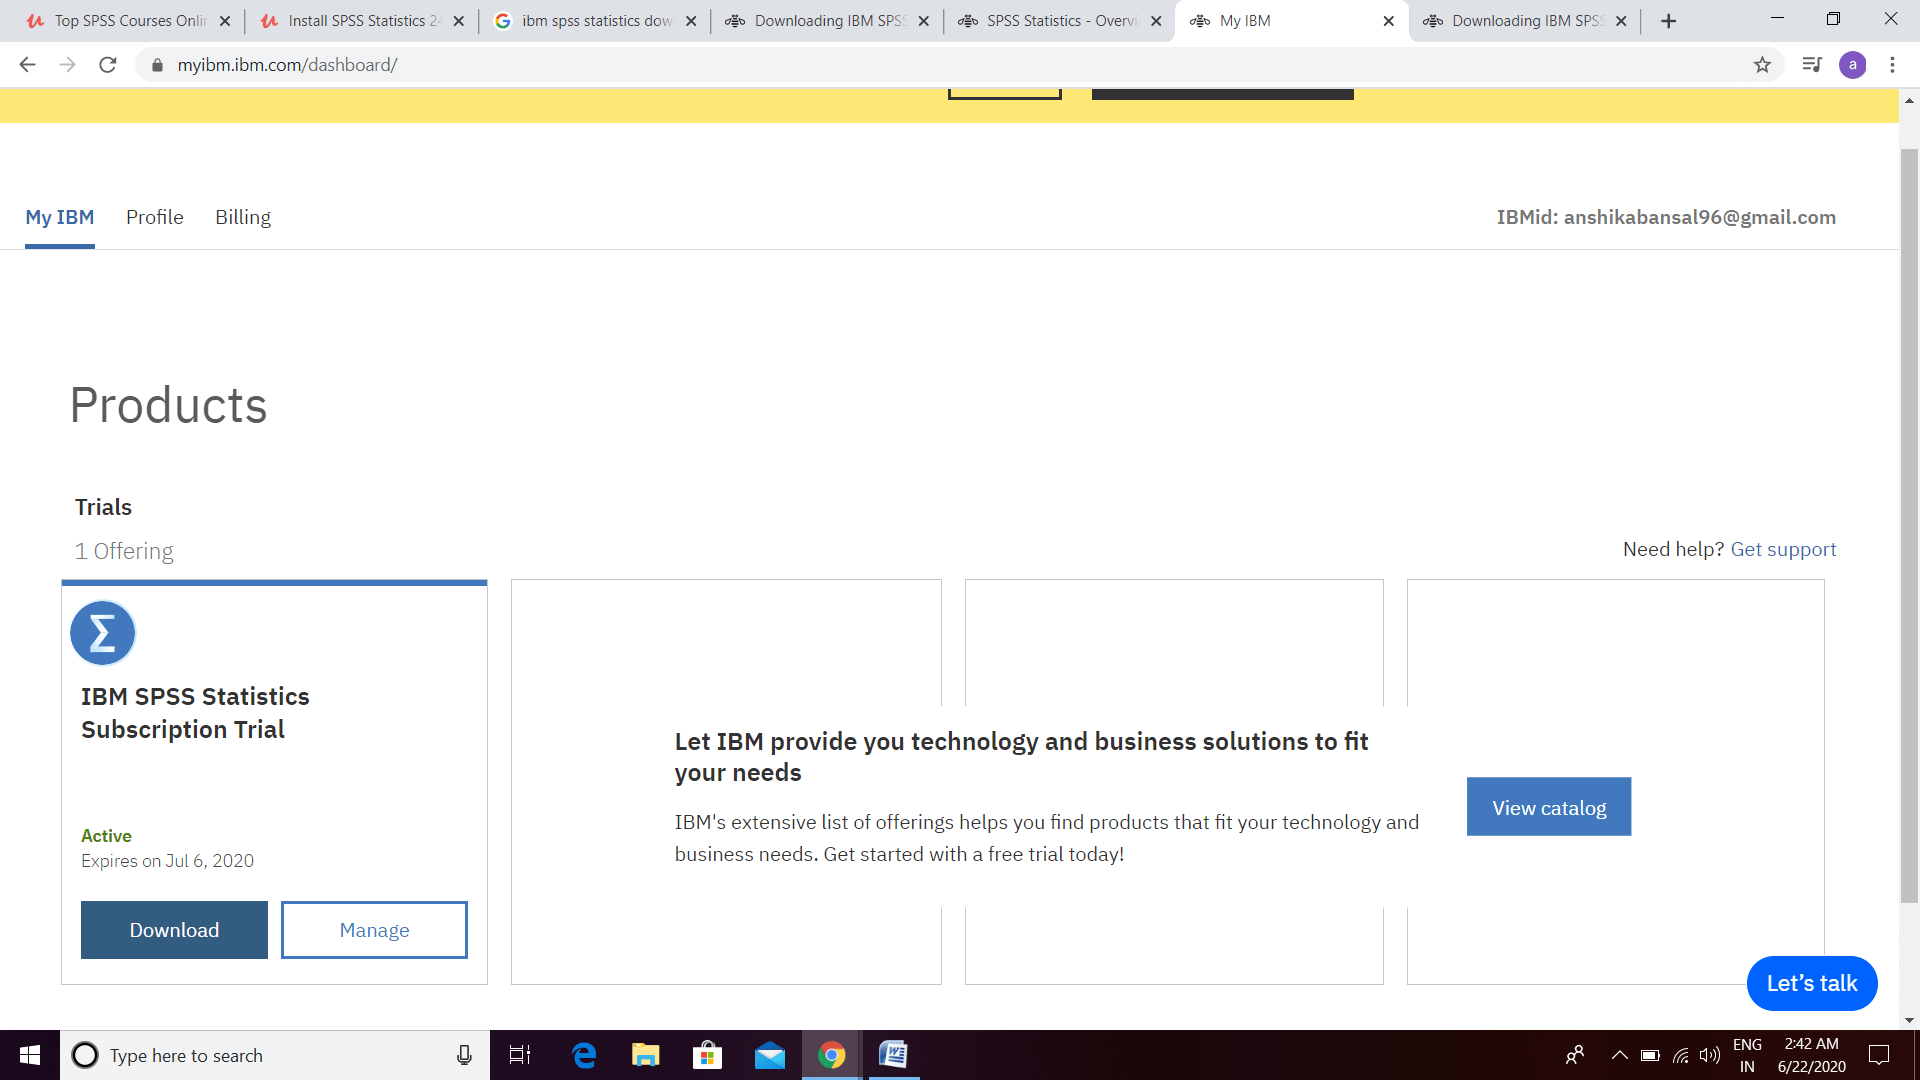
Now depending on our operating system, we will download it. Now the downloading process is completed. So we will learn how to install it.
Now we have a download file named SPSSStatisticsSub_Setup_x64. We will right-click on this file and click on the run as administrator. Now IBM software is installing the file as follows:
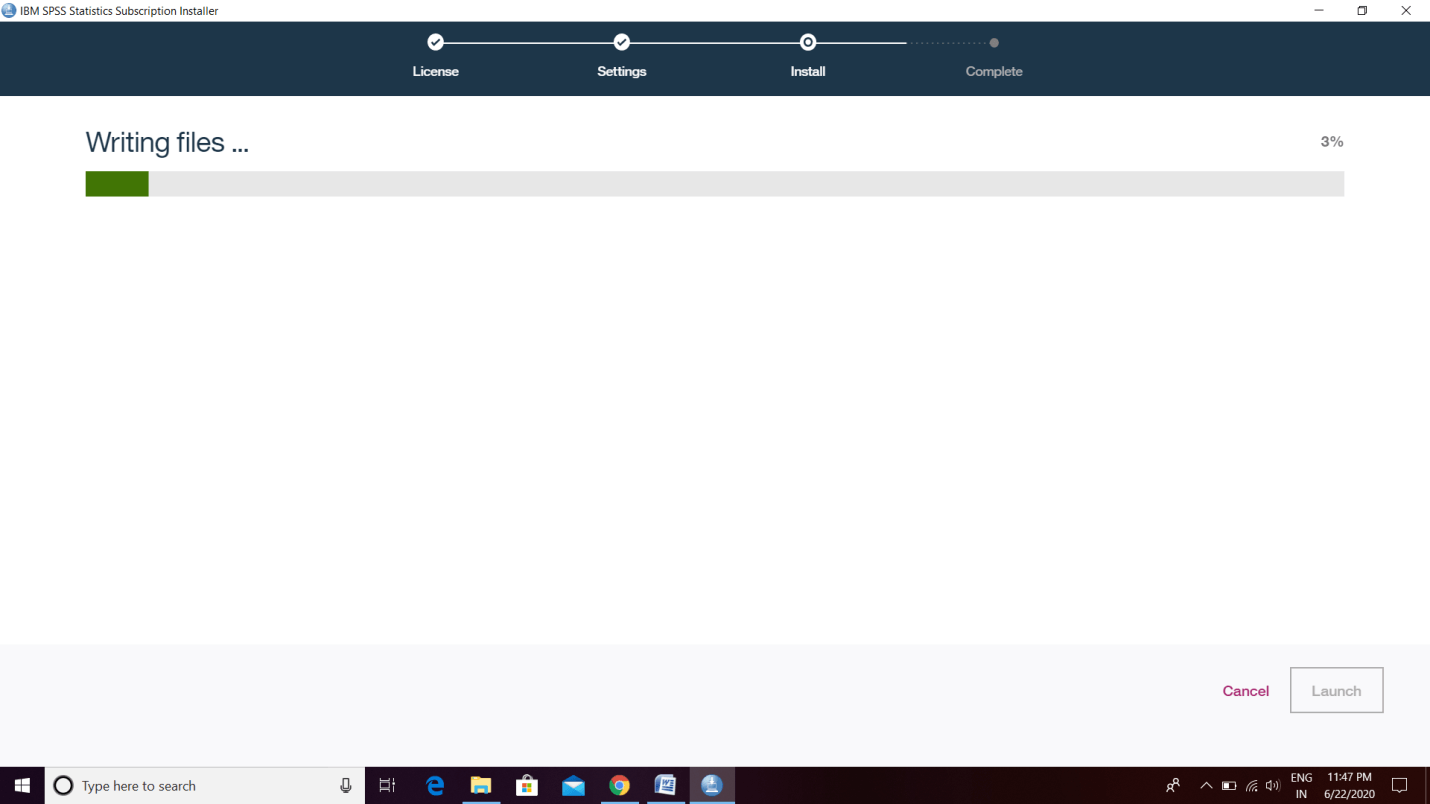
Now we have to accept the license agreement. If we want, we can read the terms and conditions.
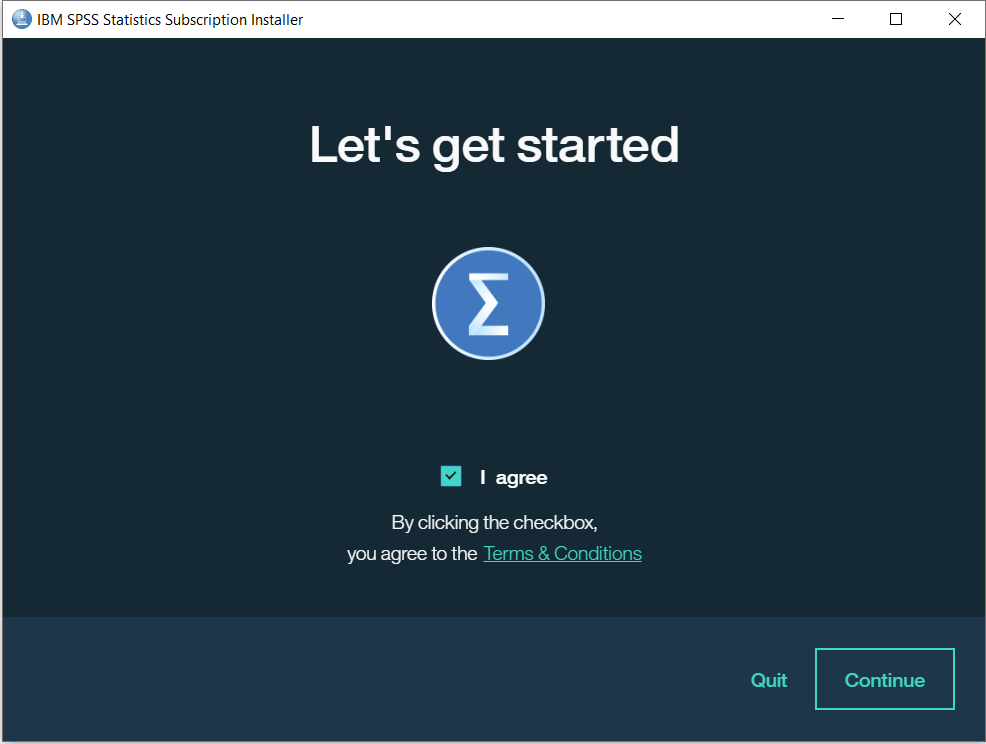
Click on the Continue option. Now the installation has finished. It will ask us to run SPSS, so we will click on launch to start the software.
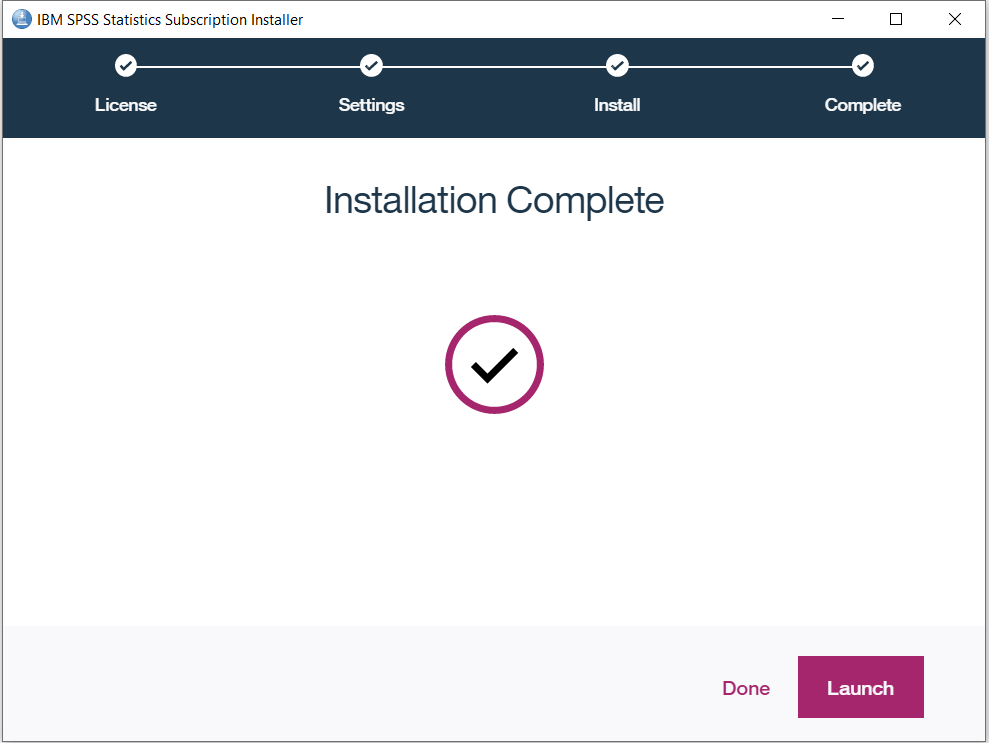
Now it will ask us to enter the IBMid and password, which we provided while downloading. After this, we will get the following window, which shows that it gives us access for 14 days. The dialog box is handy, but every time we start the software, this dialog box will look a little bit annoying. So if we don't want to use the following screen or don't want to see the screen again in the future, we just have to click on the checkbox, which shows that don't show the dialog box in the future. But if we want to see the dialog box in the future, we will leave it unchecked. Lastly, we will click on the close button.
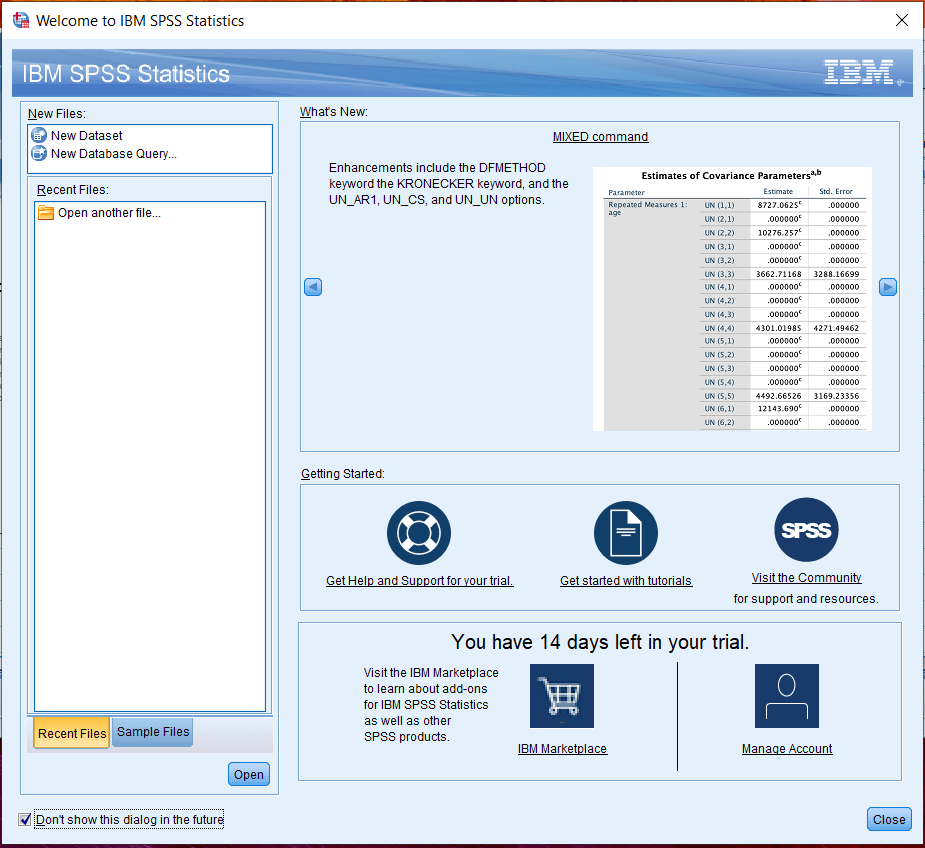
Now we are able to see the interface of SPSS software as follows:
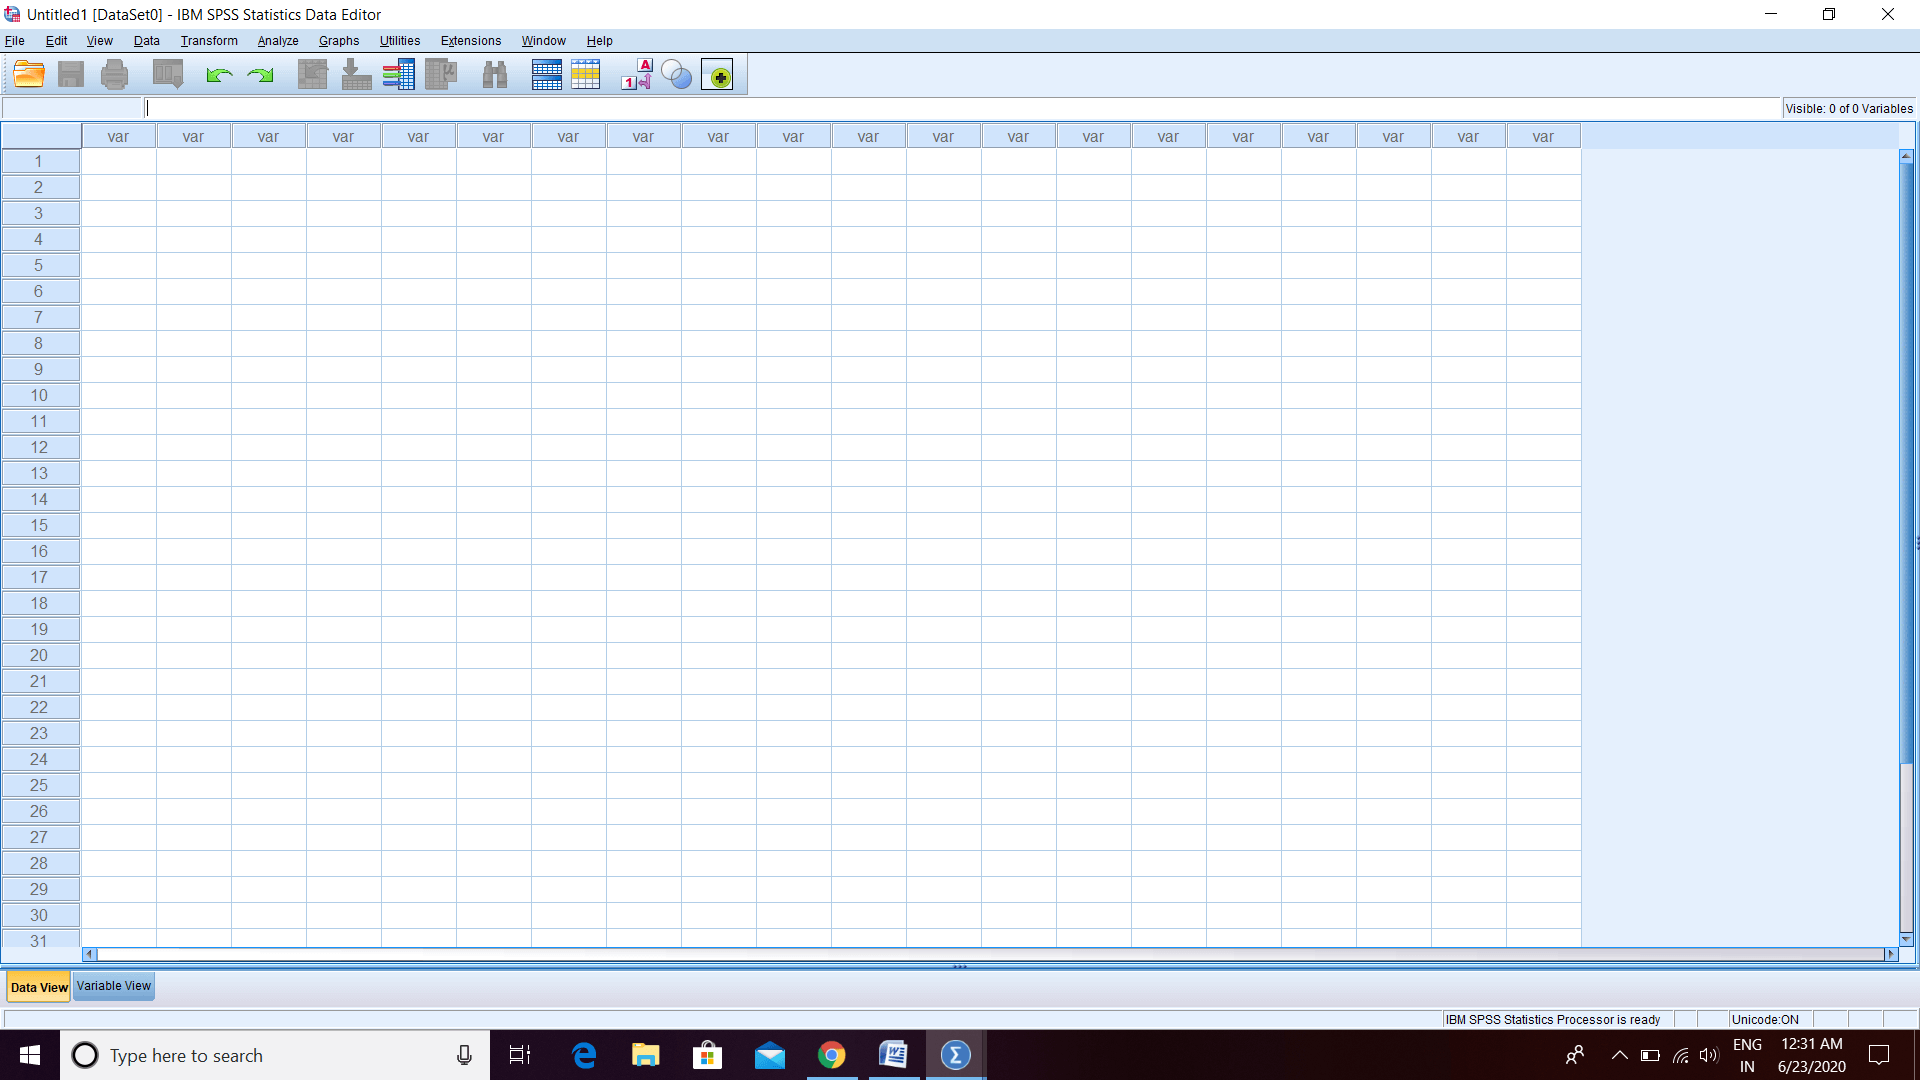
SPSS Version 26
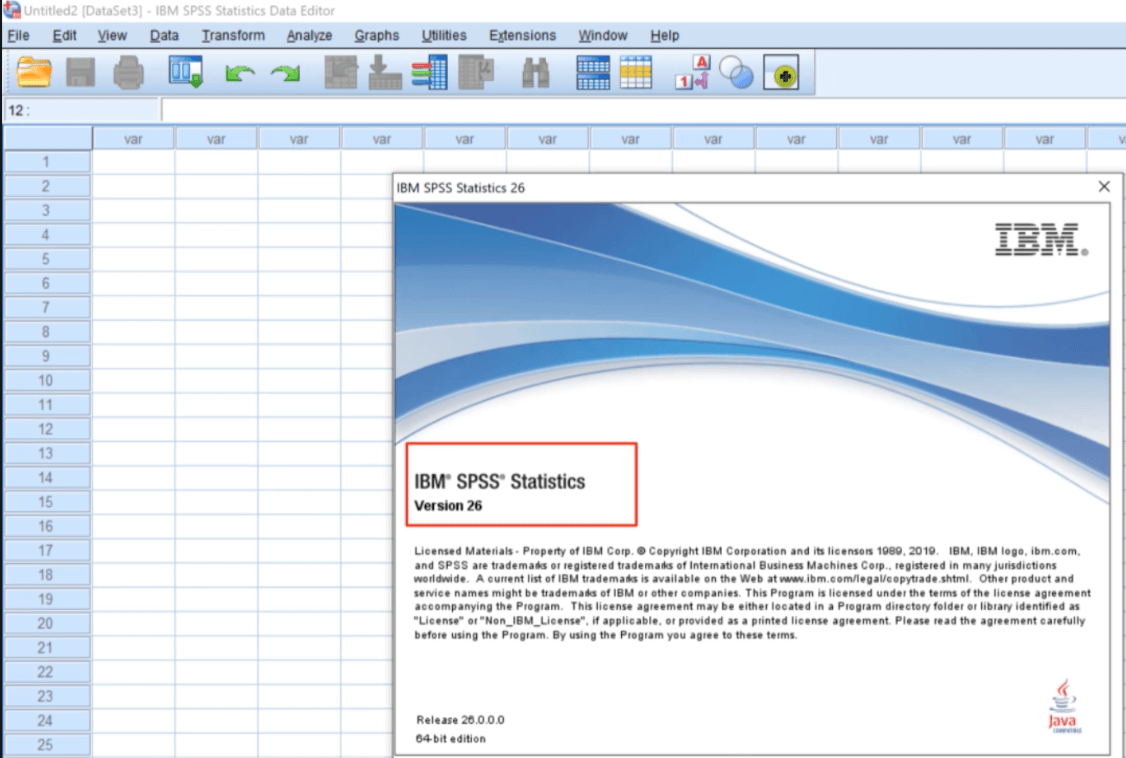
Recently IBM announces version 26 of SPSS software. Let us have a quick walk through of what is new in the store for us. We are currently running version 26 of SPSS software, and if we want to check, we can go to Help and click on About. After this we will see the following image:
Version 25 and 26 both the software have the same interface. There is no difference as such in their look and feel. If we want to look at the enhancement, just go and type on Google SPSS 26 new features and visit the following link:
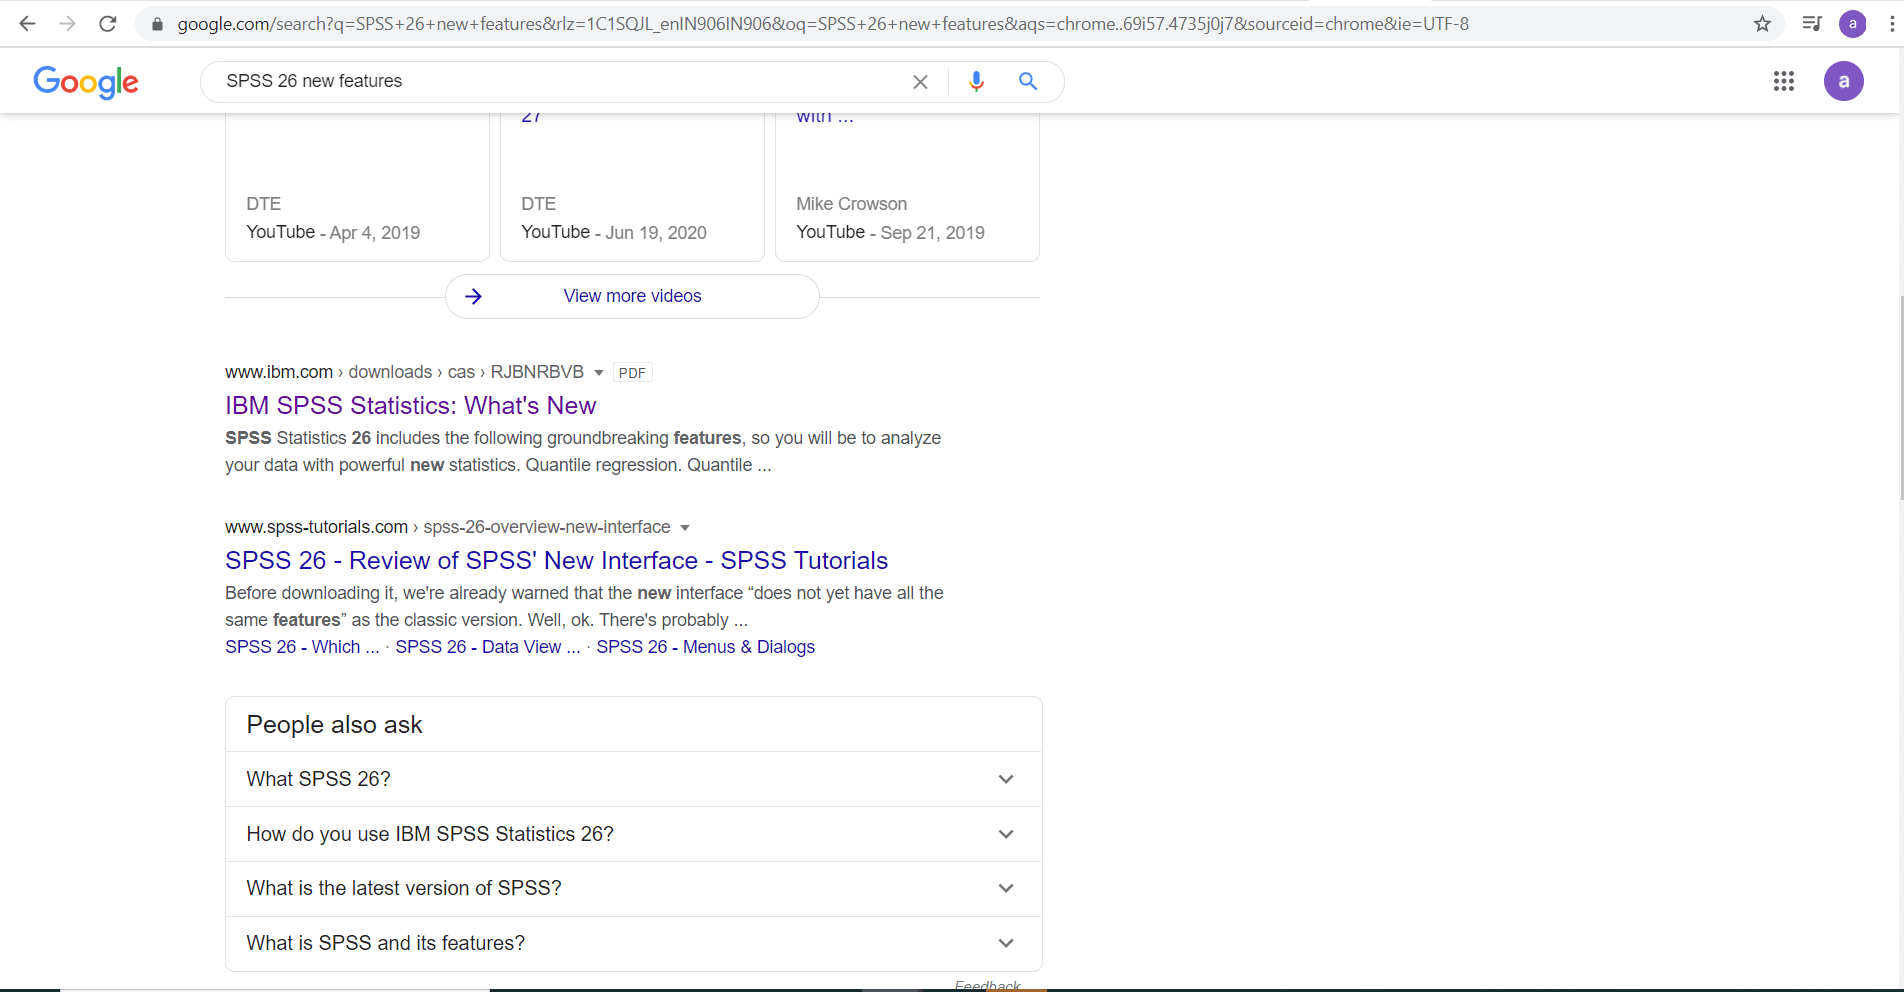
Now the above document is opened like this:
This document offers detailed enhancement about every feature that has been added in version 26. If we read it carefully, we will realize that all the enhancements that have been done in version 26 can be categorized at three levels. The first level of enhancement has been done in the Analyze menu as given below:
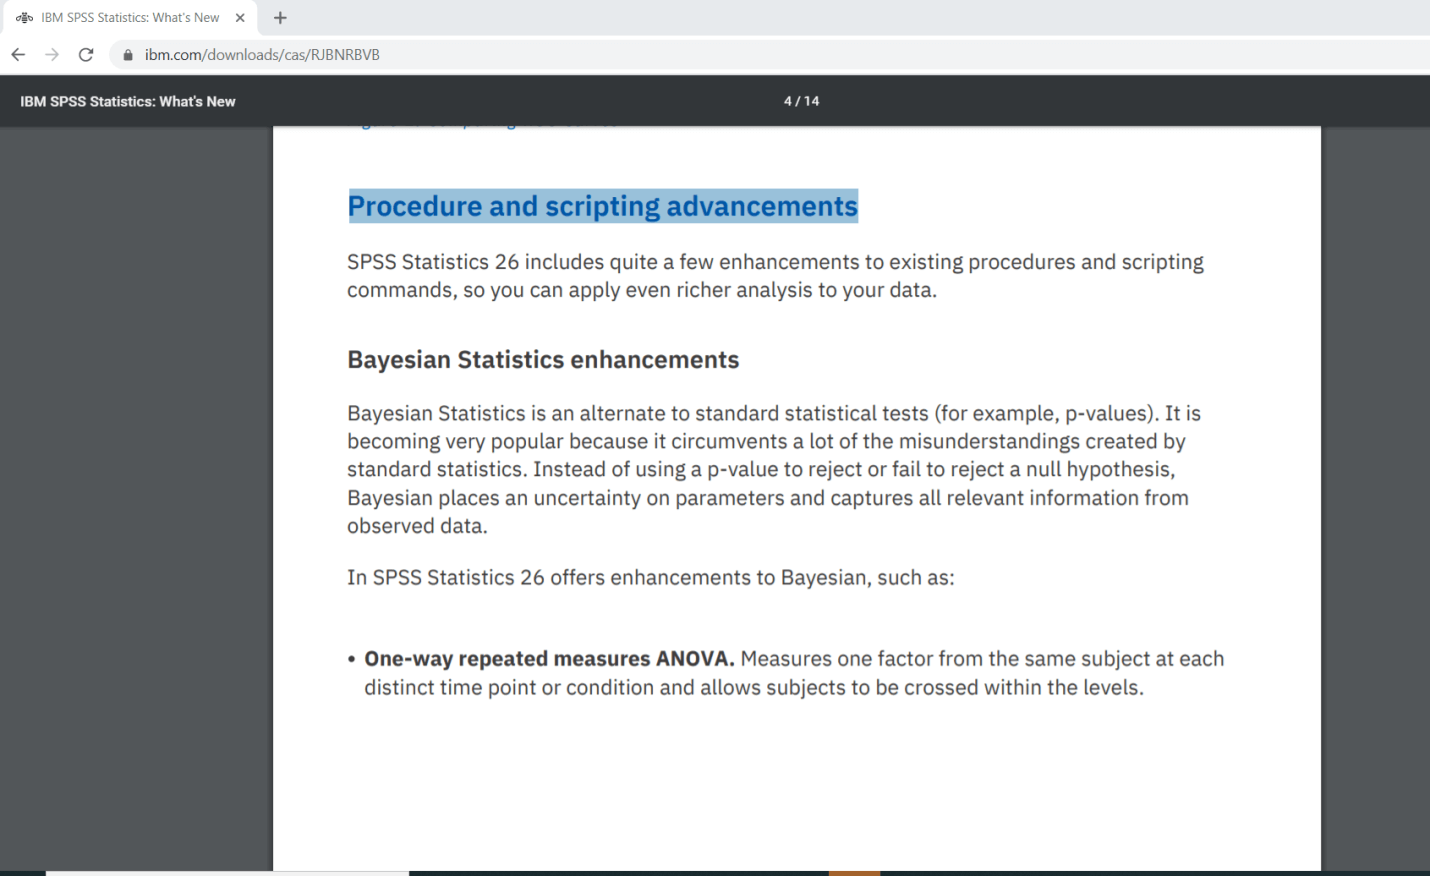
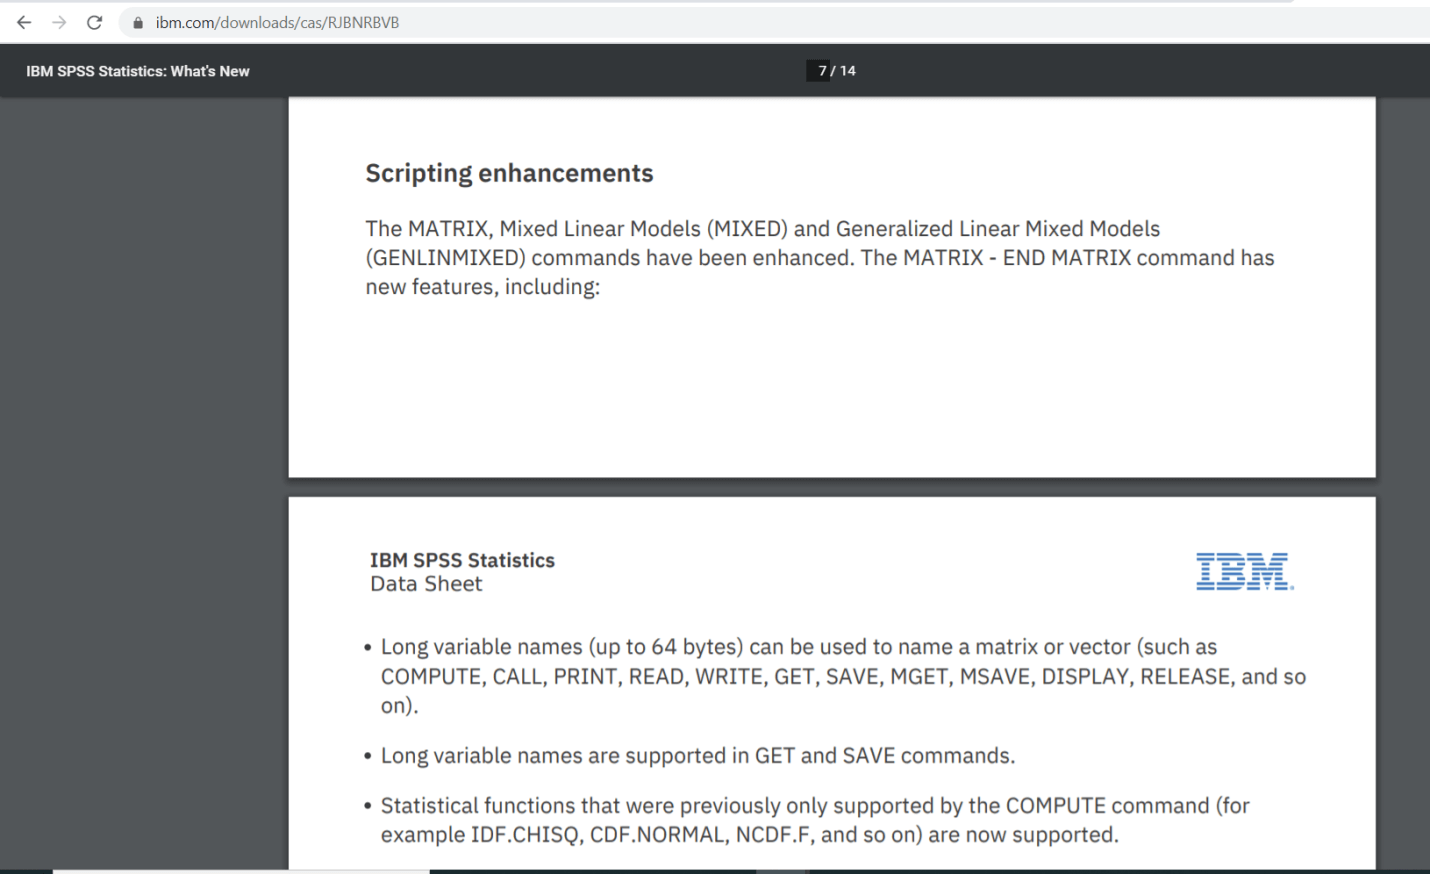
The second level of enhancements has been done in Procedure and Scripting Advancements, as shown below:
The third level of enhancement has been done in the format of Productivity.
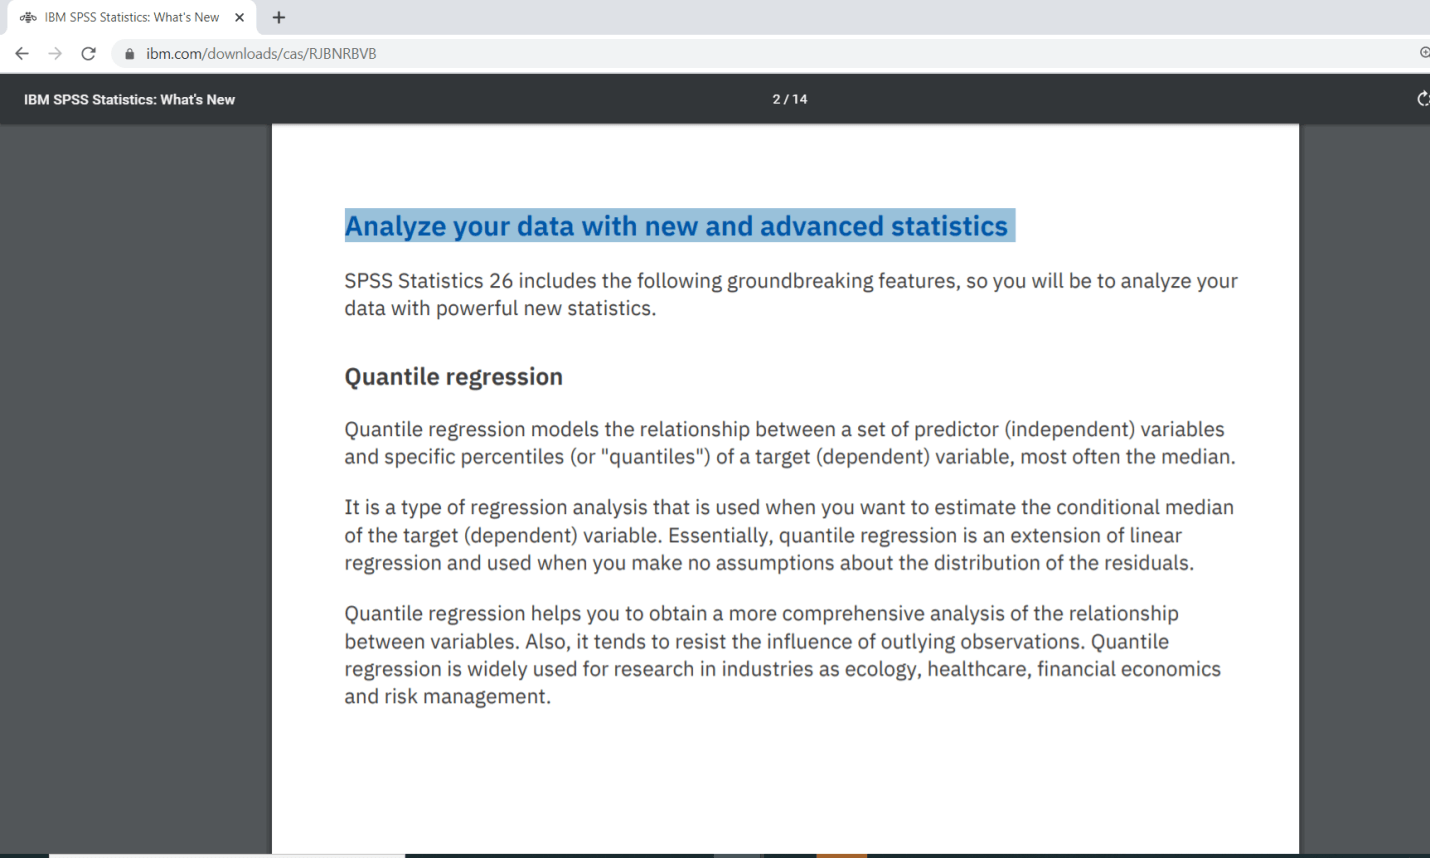
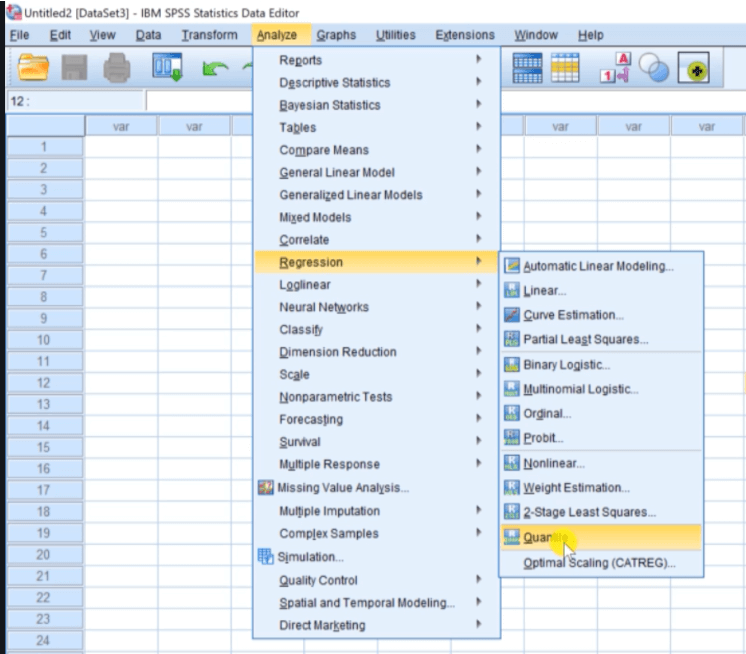
Now we will take a quick look at what they are. In the Analyze menu, if we are running version 26, we will see certain new options. For instance, quantile regression is in version 26. If we go to Analyze menu then go to Regression, then we can see the option of Quantile like this:
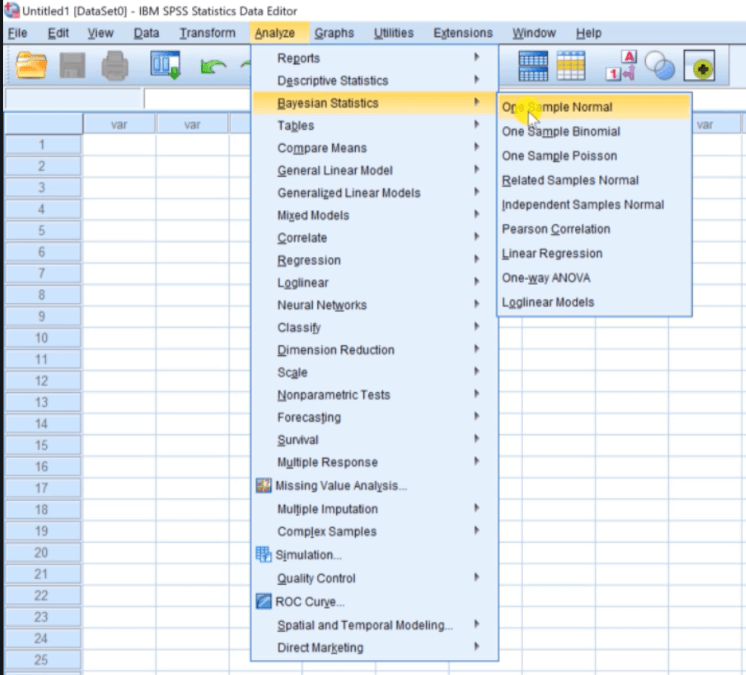
In Procedure and Scripting Advancements, the major improvement has been done in the format of Bayesian statistics enhancements. Here, we can see the options for one way ANOVA, one sample Binomial, and one sample Poisson analyses. We can see all these options by visiting the Analyze menu, go to Bayesian statistics, and then we can see all the options like this:
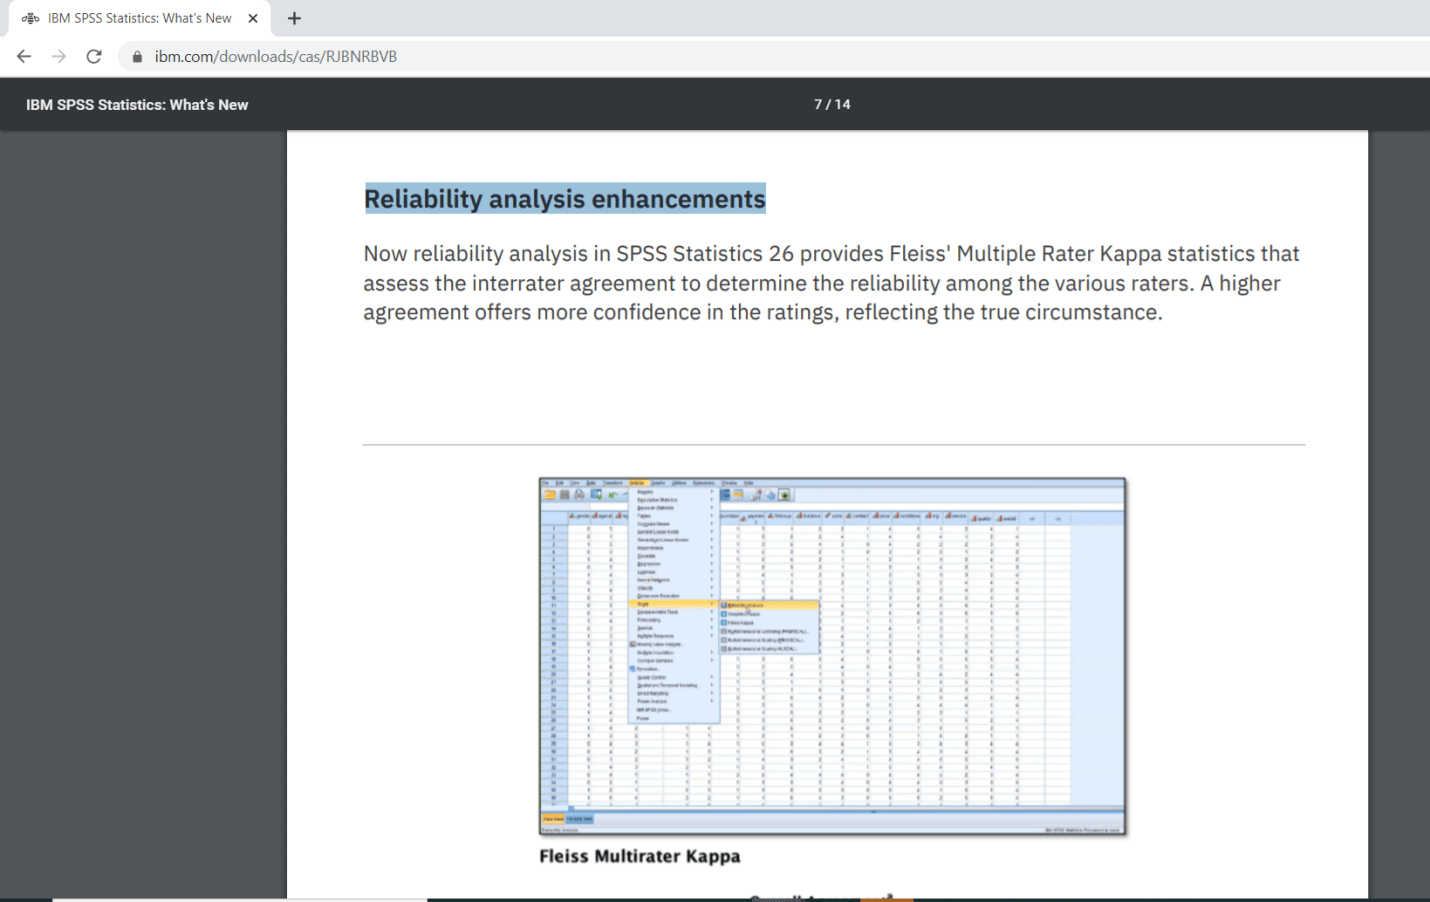
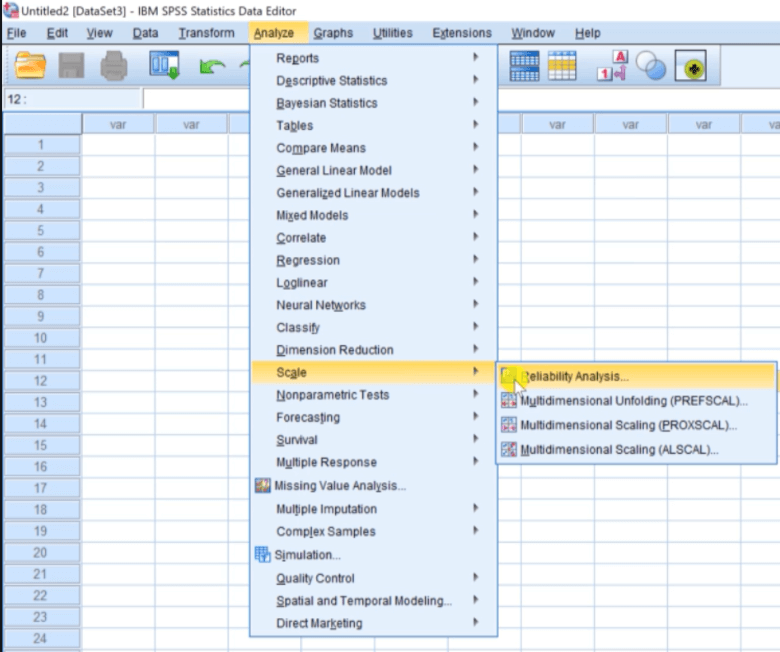
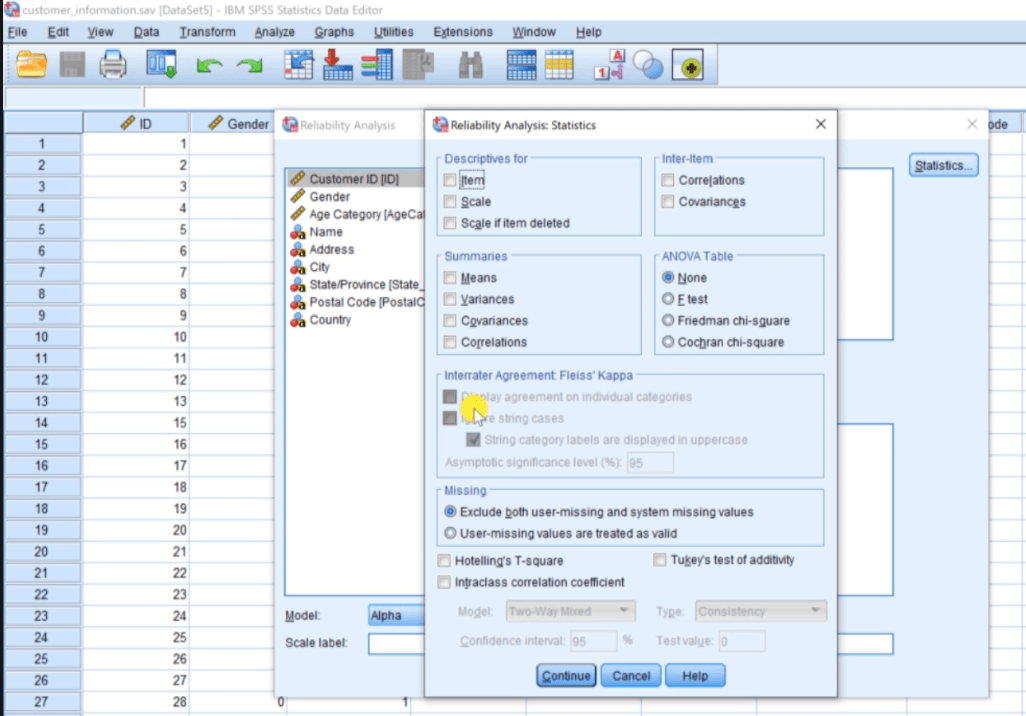
Another important improvement we will see is the Improvement in the Reliability Analysis option. So if we are using version 26, we can go to the Analysis option and then go to Scale. Now we will click on the Reliability Analysis option and then click on Open Data File and choose a New Data Set.
Now again click on Analyze option, then go to Scale and then go to the Reliability Analysis option. If we are using a new version, we will see a box for Items and Ratings separately.
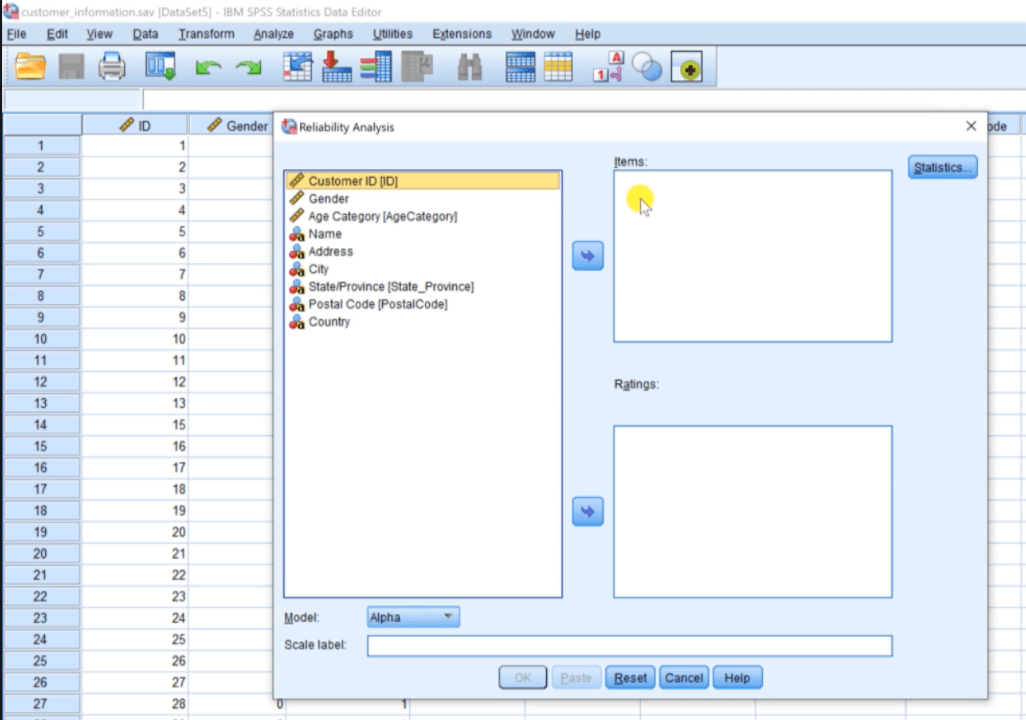
Apart from this, we have the Statistics option on the right side of Items. When we click on Statistics, we will see added enhancement for doing Interrater agreement analysis, which is not available in version 25.
In the document, we have Scripting Level enhancements in version 26. We can go through this and read it.
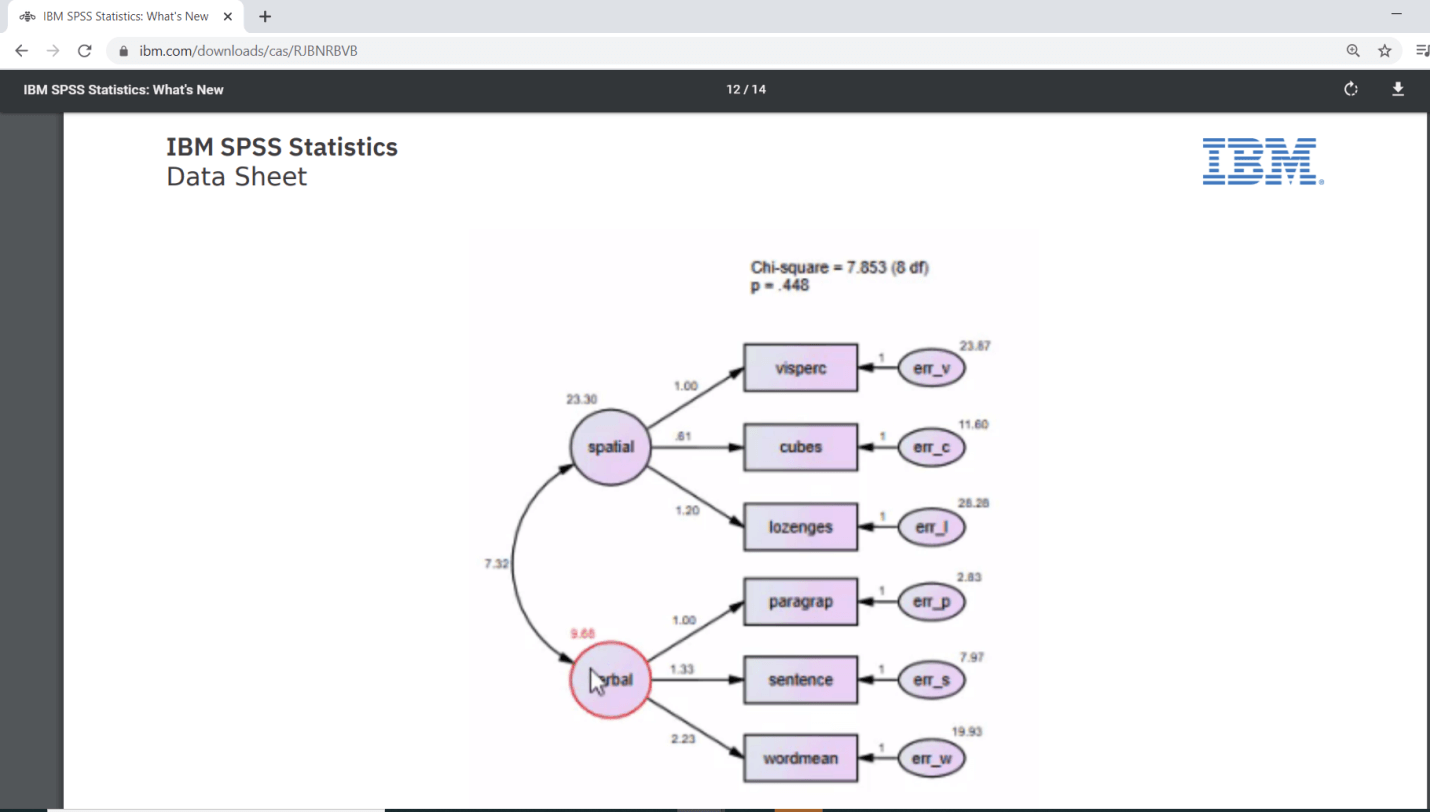
The last level of enhancements has been done at the Productivity level. In version 26, we will see enhancement in the Production facility command as well as. If we are running the latest version of Amos, we will see certain changes in the output. For instance, we will see the Chi-square statistics and some other details mentioned in the following Path diagram, which were not available in the previous version.
Statistics in SPSS
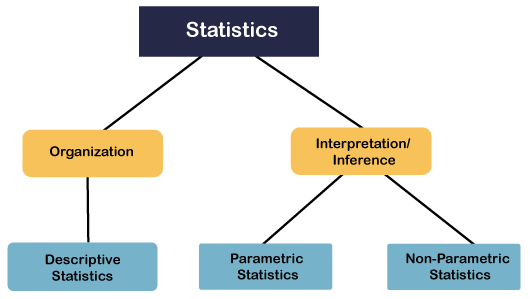
- In this section, we are going to learn fundamental or statistics. Statistics is a branch of mathematics that is used for organization and interpretation of the numerical data. When it comes to the data organization, the kind of statistics we used are known as descriptive statistics.
- So descriptive statistics is basically used to describe the situation or the event, or whatever the property that we are measuring. For example, suppose we are discussing the marks obtained by the student in the examination, we might be interested in the average marks scored by the student, or the spread or division of the marks. So mean, median, standard deviation, percentile, etc. they all examples of descriptive statistics.
- We also use SPSS to calculate the descriptive statistics, but most often, we work with the interpretation of numerical data, and we try to draw certain inferences based on the available data. So apart from interpretation, we should use inference. The practical use of statistics is to draw inference from the numerical data.
- Now, when it comes to drawing inferences, we have to go by two approaches that depend upon the nature of our data. So we can have two types of approaches here known as parametric statistics and non-parametric statistics.
- Parametric statistics refer to the kind of stats that is used to certain assumptions about the population parameters. Parameters can be mean, standard, deviation, homogeneity of variance, randomness of the selection, and dependence of samples. So if these assumptions are fulfilled, we use a kind of stat (statistics) known as a parametric stat.
- Our t-test, z score, regression, linear regression are examples of the parametric stat, but when these assumptions are violated, we use a kind of stat known as a non-parametric stat. For example, mann whitney u test or most popular chi square test. These are the test we use when our data fails to meet one of the four assumptions recommended for the parametricity.
SPSS Parametric or Non-Parametric Test
- In this section, we are going to learn about parametric and non-parametric tests. If we use SPSS most of the time, we will face this problem whether to use a parametric test or non-parametric test.
- The first person to talk about the parametric or non-parametric test was Jacob Wolfowitz in 1942. He tried to draw a distinction between those tests, which make assumptions about the nature of a variable in their population. If we already know about the population and we develop a test basis on those assumptions and apply a test, in that case, our result is more generalizable.
- Suppose we are studying an age variable. Suppose we want to find out some conclusions about the age. We are already aware of how the age is distributed in the population or entire population or the Indian population or American population. In that case, whatever test we are going to use will give us a more generalizable result.
- While other cases, when we are not aware of the features of variables that we are studying, especially in the population, then we will not create a situation where the result would be generalizable. So that was the beauty of the parametric test. That's why our researcher, supervisor, or general editor often nudges us to use parametric tests more often as compared to non-parametric tests.
- The results of parametric tests are more generalizable as compare to non-parametric tests. In the Parametric test, we are sure about the distribution or nature of variables in the population. So if we understand this, we can draw a certain distinction between parametric and non-parametric tests.
Difference between Parametric and Non-Parametric Test
The following differences are not an exhaustive list of distinction between parametric and non- parametric tests, but these are the most common distinction that one should keep in mind while choosing a suitable test.
| S.NO. | Parametric Test | Non-Parametric Test |
|---|---|---|
| 1 | Normality of Distribution | Non-normal Distribution |
| 2 | Homogeneity of Variance | Non-homogeneity of variance |
| 3 | Independence of Observations | Dependence of observations |
| 4 | Randomness | Non-random |
| 5 | Interval scale measurement | Non-Internal Scale Measurement |
1. Normality of distribution shows that they are normally distributed in the population.
Non-normal distribution specifies that we are not aware of the distribution of the population.
2. Homogeneity of variance specifies that different groups which we are using must have the same variance.
A12 = A22 = ……= An2
Non-homogeneity of variance specifies that the parametric condition might be violated in a non-parametric test.
A12 ≠ A22 ≠ ……= An2
3. Independence of Observations specifies that observation of one candidate or subject in no way affect the observation of other candidate or subject.
Dependence of observations specifies that observation of one candidate or subject affects the observation of other candidates or subjects.
4. Randomness specifies that the sample must be randomly drawn from the population.
Non-random specifies that we are not randomly drawn to our sample, and all the subjects which are part of our study will not be randomly selected.
5. Interval scale measurement specifies that our data will be measured in an interval scale, and the quantity of measurement between two intervals of a scale remains constant throughout the scale.
Non-Interval scale measurement specifies that the parametric condition might be violated in a non-parametric test.
SPSS Variables
In this section, we are going to learn how to conceptualize the variables and how to name them in SPSS. The data entry in SPSS begins with understanding the variables like our variable name, how they are defined, and what label we will use to measure them. It's very important that before we start entering our data, we have a conceptualization of our search variable. In SPSS, we have two types of variables, i.e., independent variables and dependent variables.
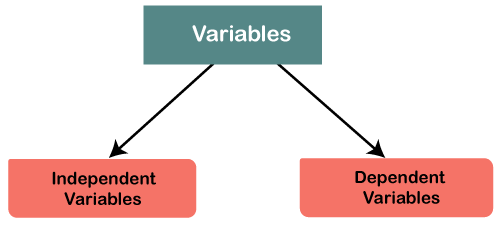
Apart from them, we should also have like what are the variables, which are playing the role of mediating variables or which are playing the role of moderating variables. The important thing is to conceptualize our variables.
Example 1:
Suppose we are taking a study where we want to see the effect of one variable over another or the relationship between two variables. In an IT study, what exactly leads to good performance. We know that it's hard work that leads to performance. But we also know that relationship is not at that simple. There might be many other variables involved. We are supposed to explore this issue, and we want to just find out the variables that influence the performance of a student.
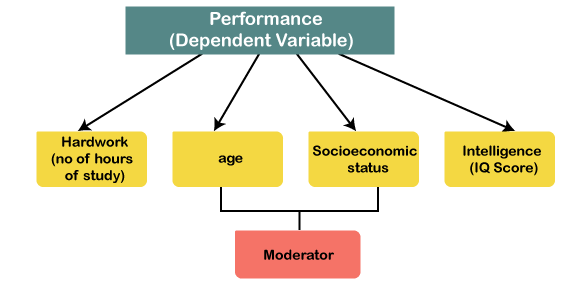
Now in this study, performance is acting like a dependent variable. Because it is a performance that we want to predict and that we want to estimate based on other variables like hard work. Apart from hard work, we might believe that the age of the subject may also act as an influencer in this variable. The socioeconomic status of the subject might also play a role in the performance of the student.
To understand this, we are going to assume two students who are from a higher socioeconomic status. They can access better resources that can help them in performing better. So, we should define all our variables first in our research model, and then we will try to enter our data into SPSS. So, let's take certain variables, for example, hard work is socioeconomic status. Now, if we look at these variables, we will find that there is a bit of ambiguity the way they have been expressed.
For example: what do you mean by hard work, how to measure the hard work. If we have to be more precise, then we have been mention we will measure the hard work in terms of the number of hours of study. It might also affect the performance, but we are not expecting each to affect the performance directly. They might act like a moderator or performance, but not the direct precursor of performance.
So, we want a model in which age and socioeconomic status act like moderators. Moderators are those variables that moderate the relationship between independent variables, and dependent variables mean they are significantly going to affect the relationship between these two variables. Apart from moderators, there might be mediators as well as involved in the model, but we are not going to take mediators now.
Now we will take one more important variable that can affect the performance let's call it Intelligence. So, Intelligence might also affect the performance. So, we are expecting a direct influence of Intelligence on Performance. Intelligence is again a way toward how we are going to measure it. So, we can measure Intelligence as IQ scores of the subject. This is how we will define our research model.
Example 2:
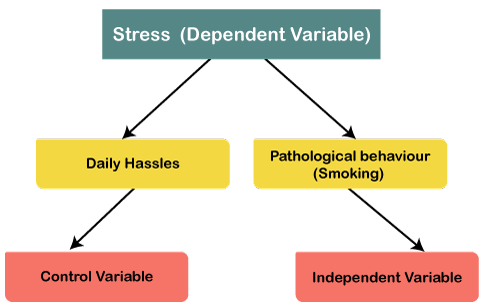
Suppose we want to find out what exactly leads to stress. Stress can be caused by problems we can call it daily hassles. Apart from it, stress can cause due to pathological behavior like smoking. Smoking is an independent variable, while stress is a dependent variable. We want to control the effect of this variable called Daily hassles because we know that daily hassles lead to stress. We want to understand that if daily hassles are the same for everyone, what does the influence of smoking on stress is. In this case, we can consider daily hassles as a control variable.
Once we have conceptualized our model, we can start defining our variables. In example 1, the control variables can be classroom conditions, temperature, or noise.
SPSS Numeric Variable
In this section, we are going to enter all the variables one by one. So, the first variable we want to record is our independent variable, i.e., hardwork. To type the name of a variable, we can simply click on the name and start typing it and then press enter. Once we enter it, we will see that rest of the fields have been automatically populated like this:
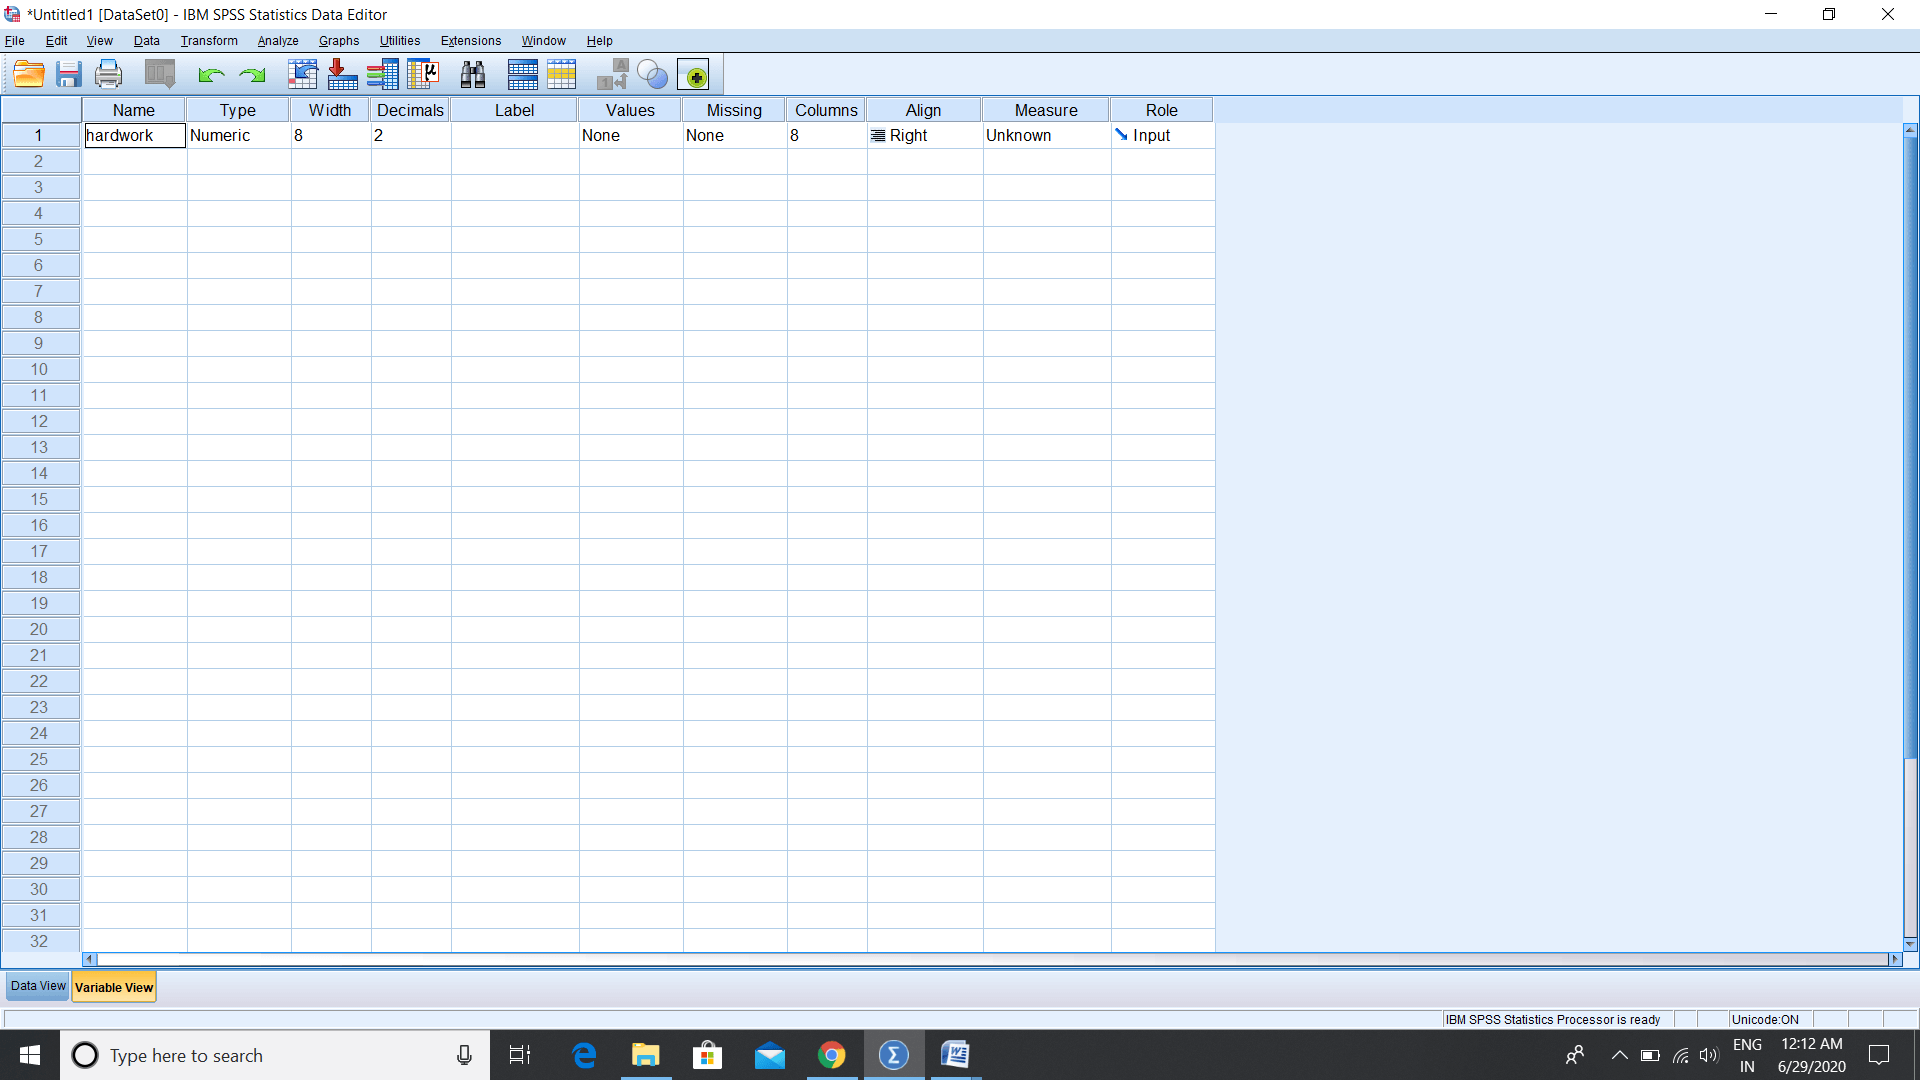
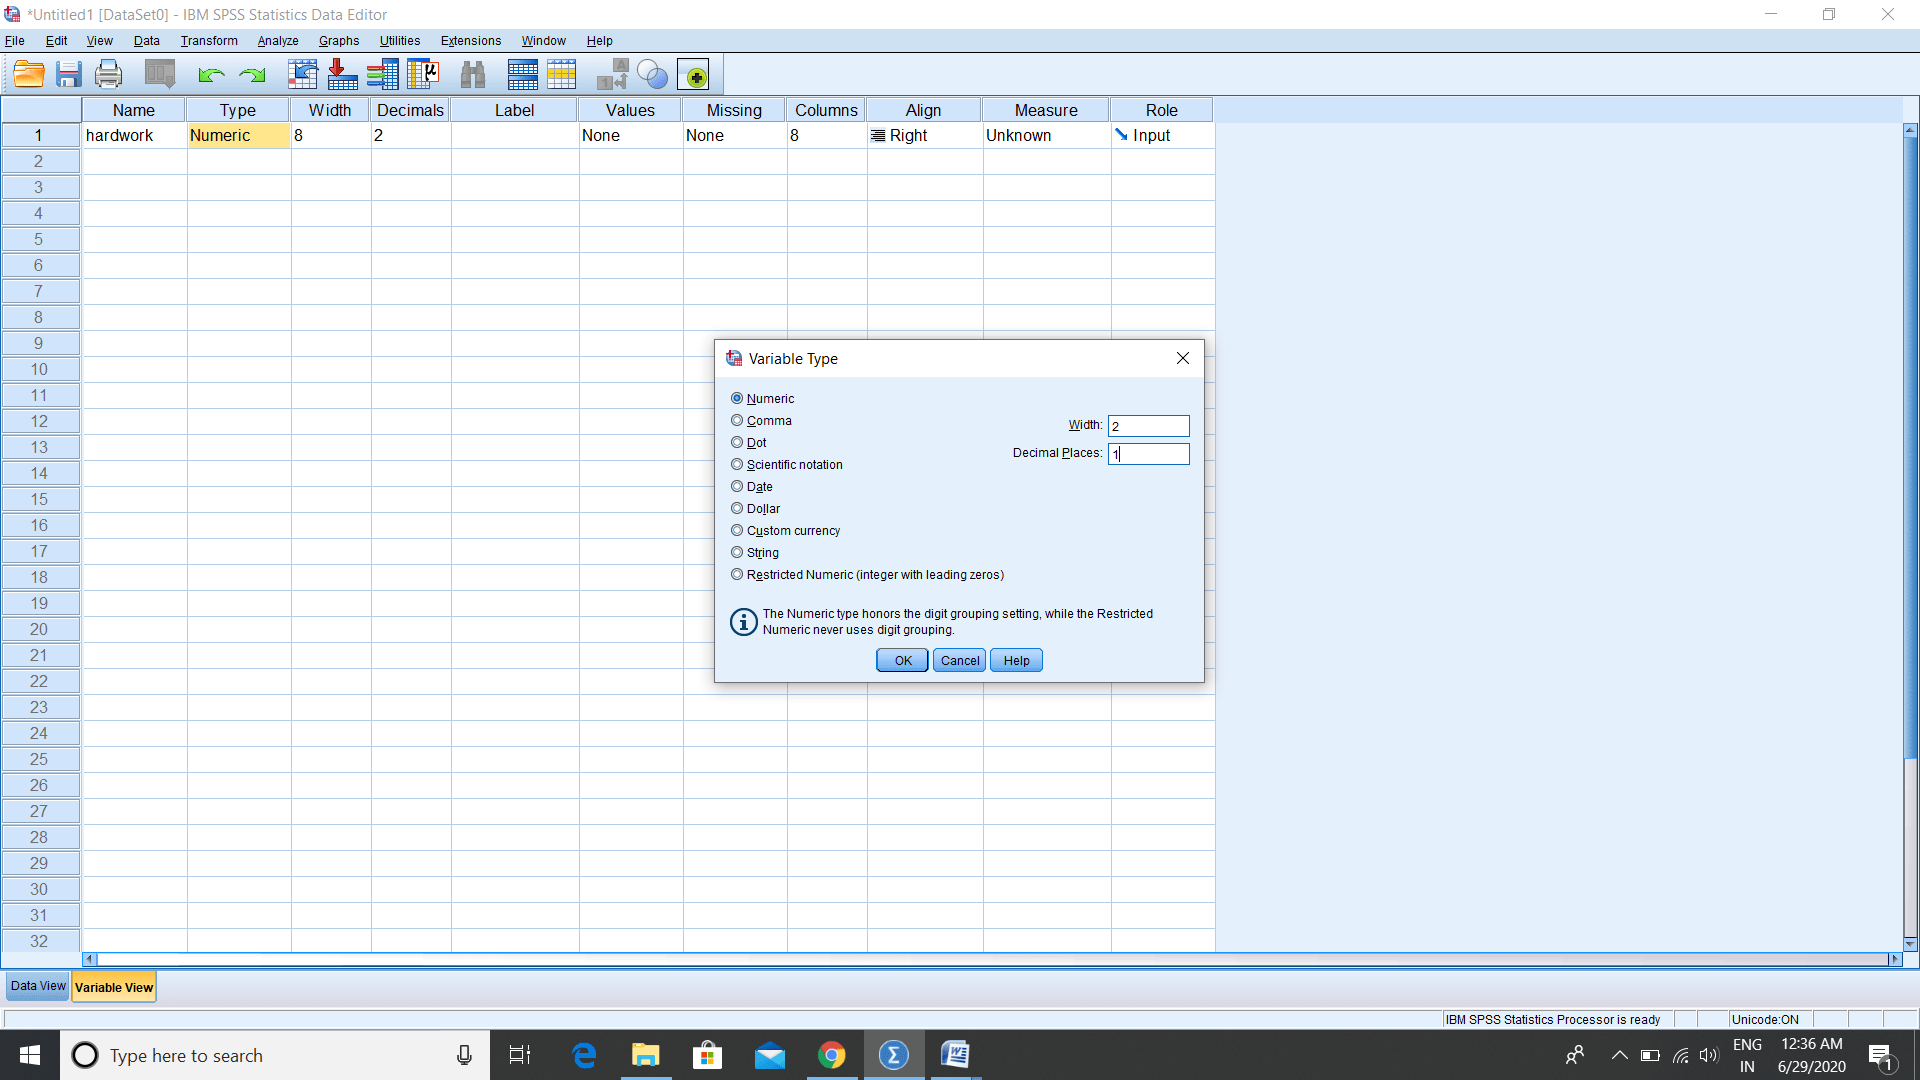
Once we typed the name of a variable, space is automatically defined as a numeric variable in which numeric stands for a number. By default, any variable is a numeric variable, but we can change it to other variable types. But we know that it is going to measure in terms of the no of hours, so that is going to be a numeric variable. So, we will let it as a numeric variable. To change the Type, width, and decimals of variable, go to the Numeric Type and click on the three-dot, shown in the following image. We can also define the width and decimal places. A Width is a number of digits that we are going to have. For example, we believe that the max number of hours a student can study is 24, so we need 2 digits for width. The number of hours can be in decimal, so we will record it in hours, minutes, and seconds, so we will set it as 1. So, our variable, name, width, and decimals have been defined as follows:
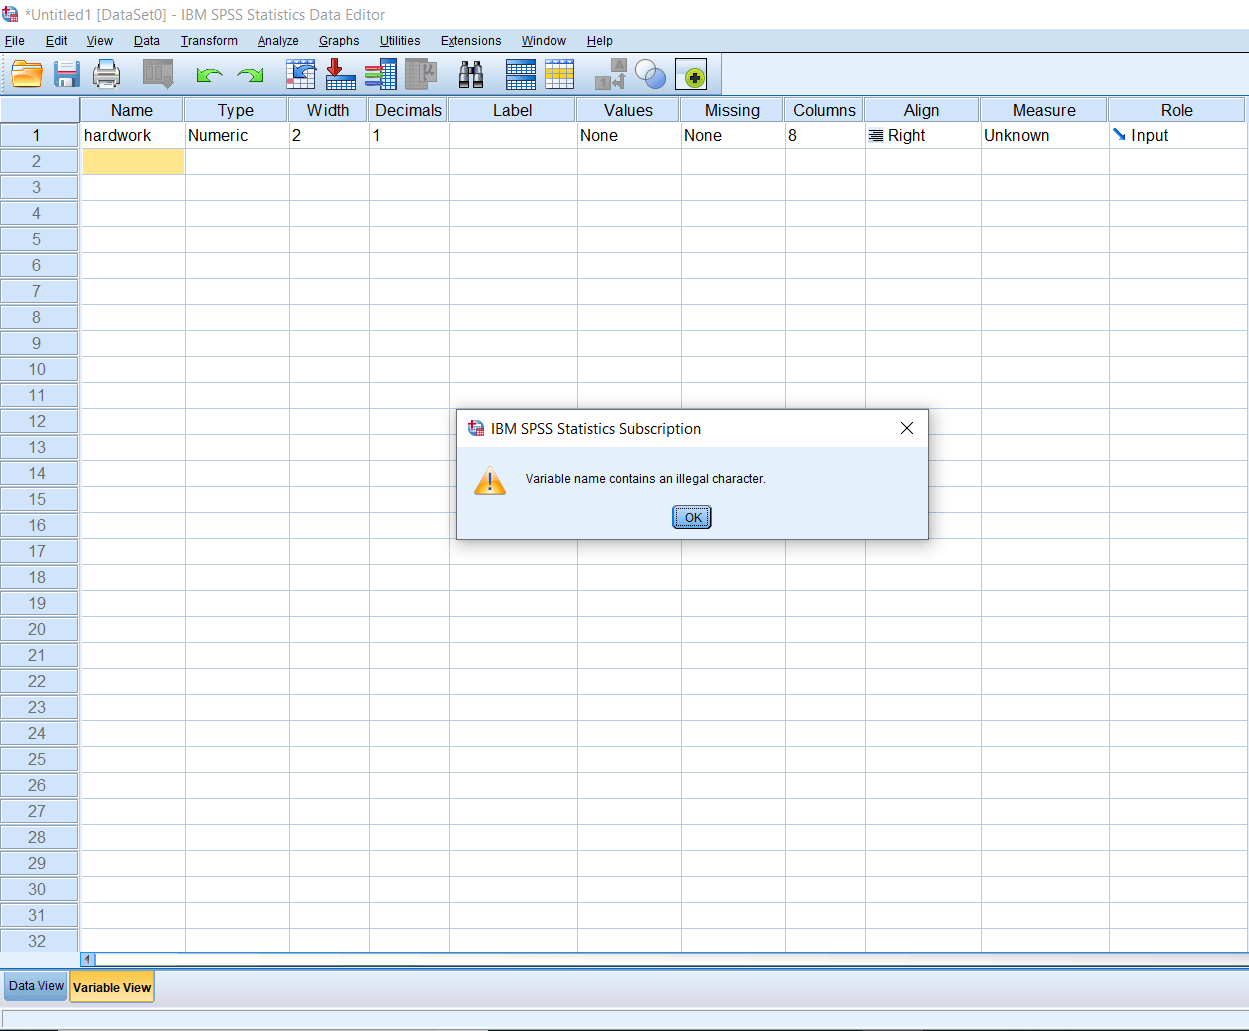
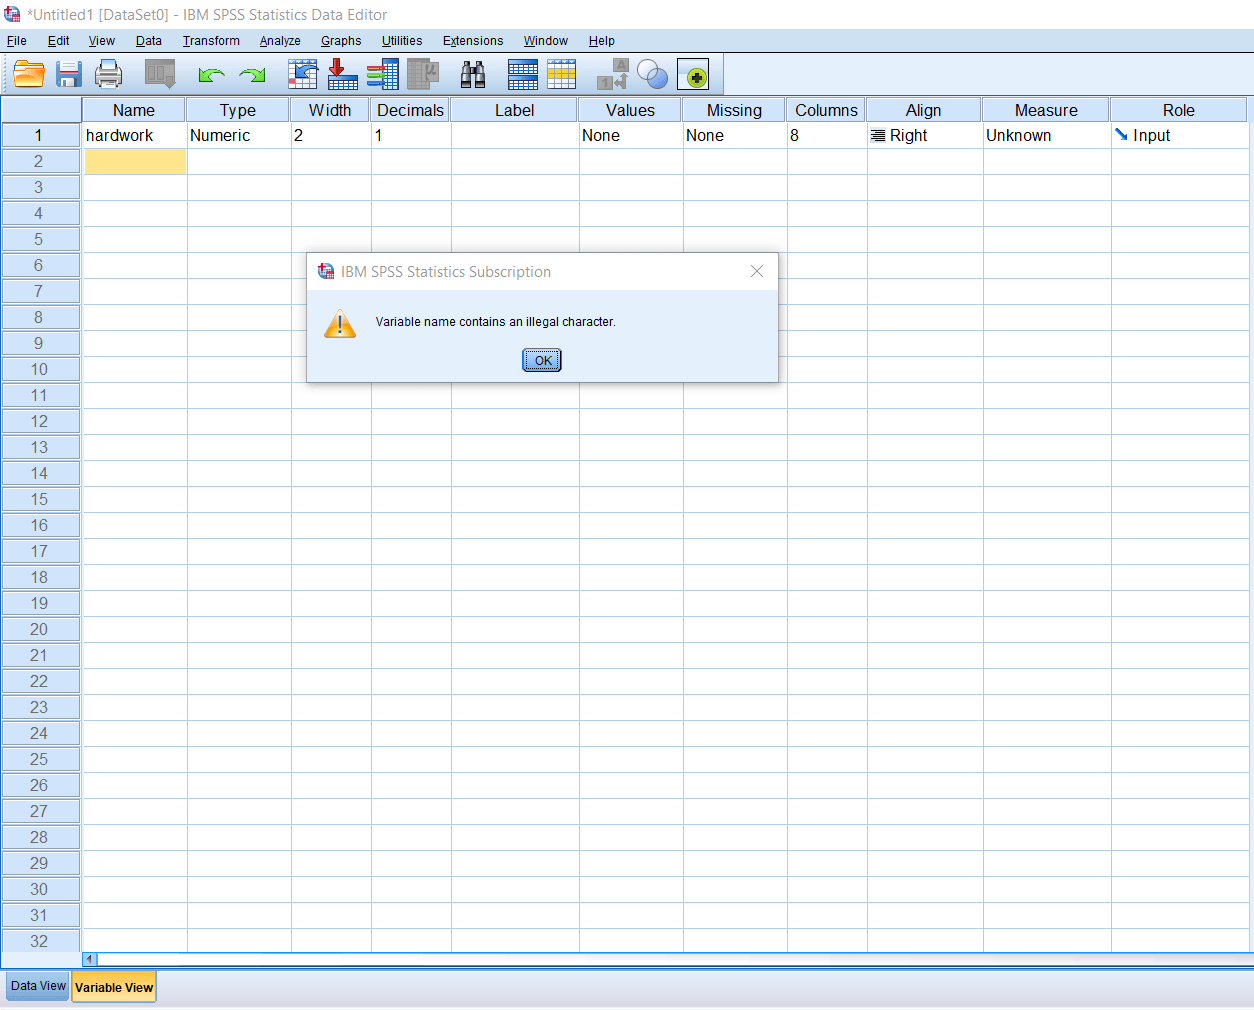
There are certain conventions of defining variables names in SPSS. We cannot have a space between the variable names. If we write a space between variable names and press enter, we will get an error warning like this:
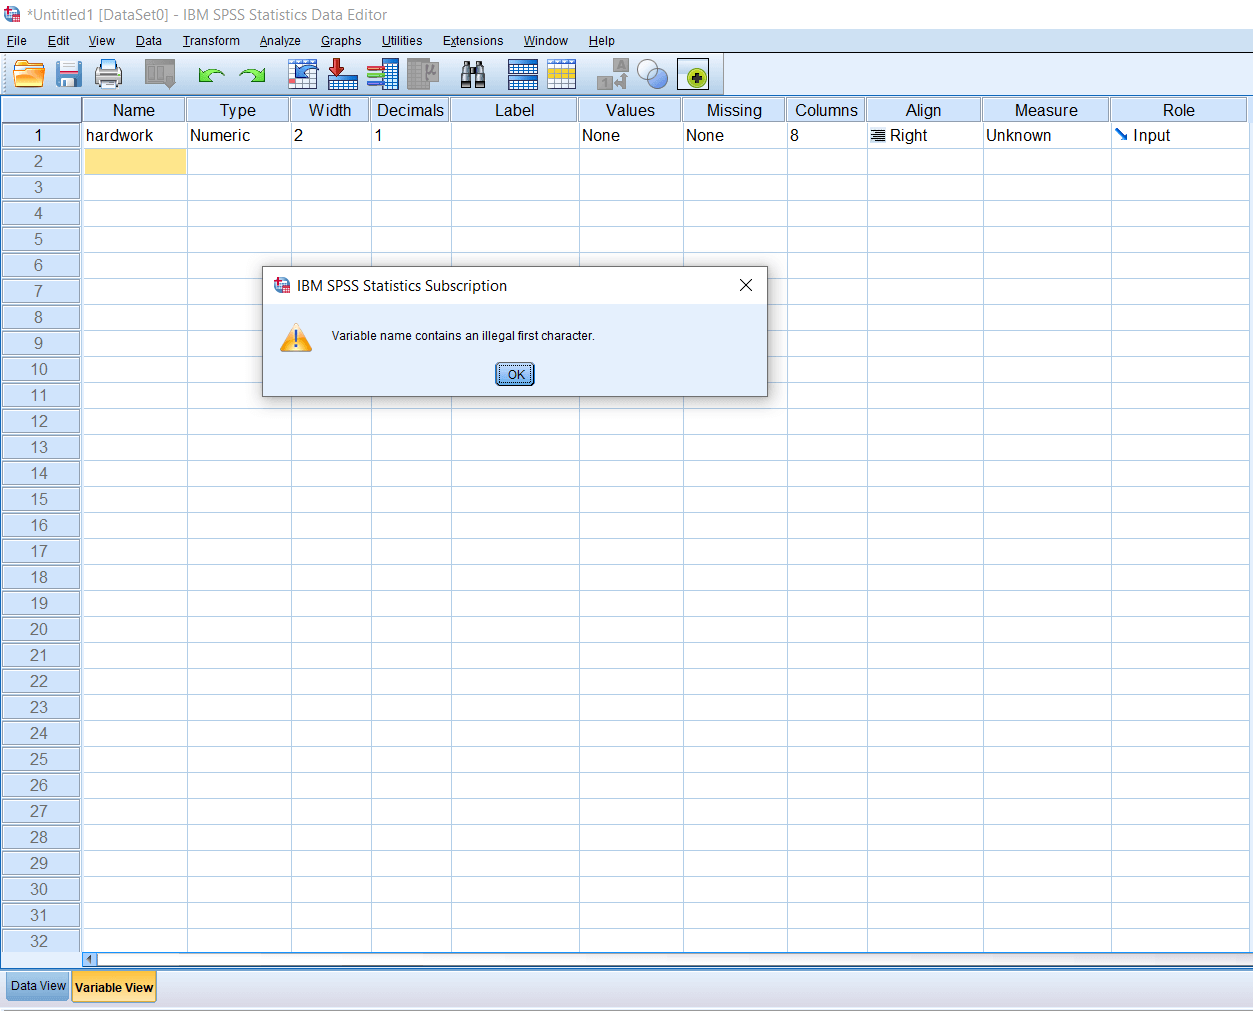
We cannot begin a variable name by a number or a special character. If we write 1hardwork, we are going to get an error warning like this:
But if we want to write 1, we can write it as a hardwork1. If we want a space between the name, we can use an underscore(_), but not space. We cannot have dolor($) in the beginning. If we write $hardwork, we will get an error warning like this:
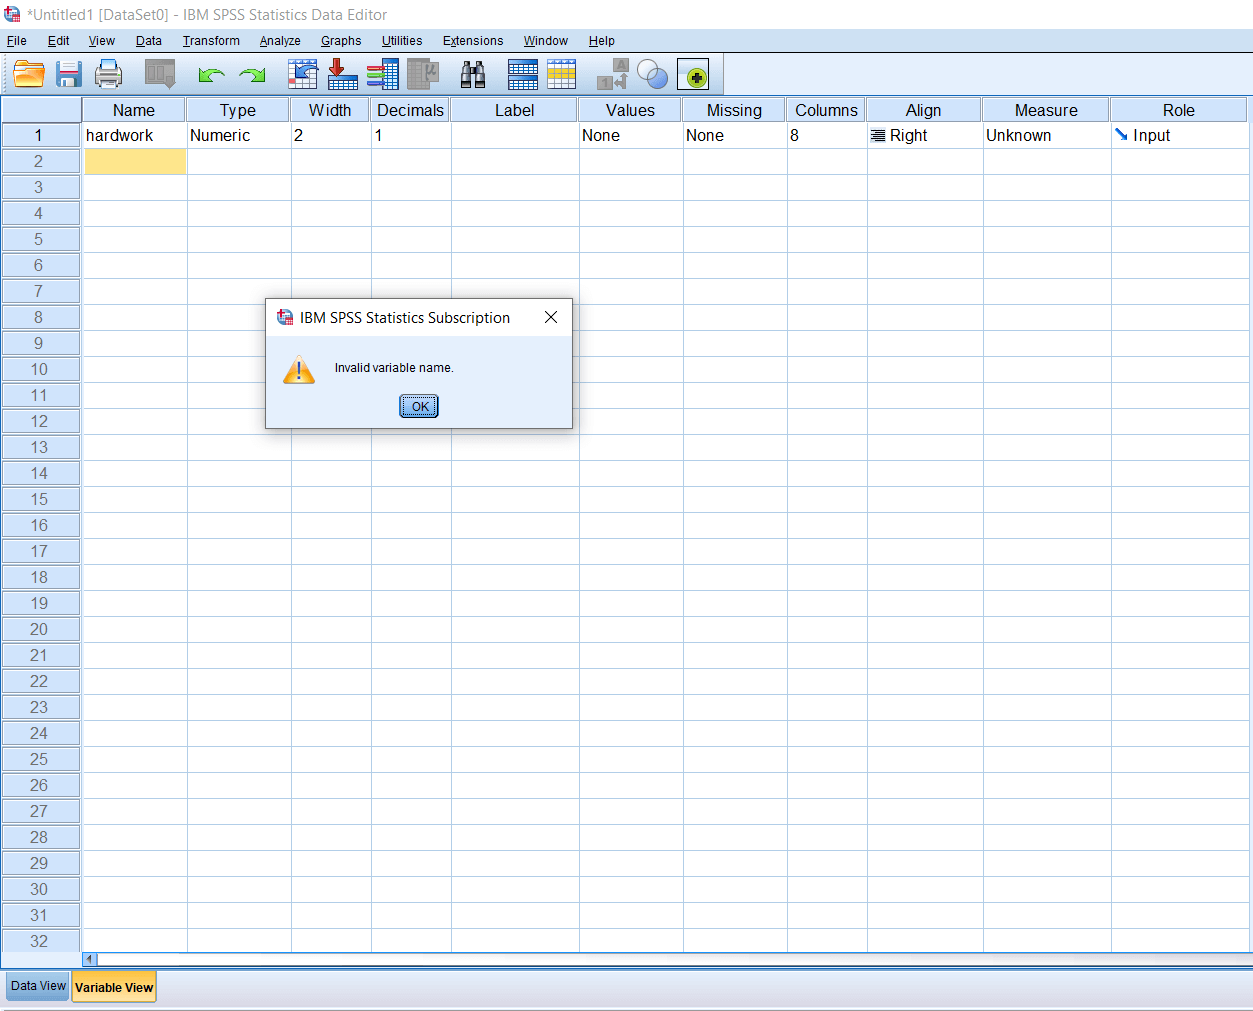
We can have dolor in between the variable like hard$work. So, most of the restrictions apply at the beginning of the variable names. Similarly, we cannot have a slash(/), comma(,), anywhere in between the variable name. If we write har,dwork, or hard/work, it will give an error warning like this:
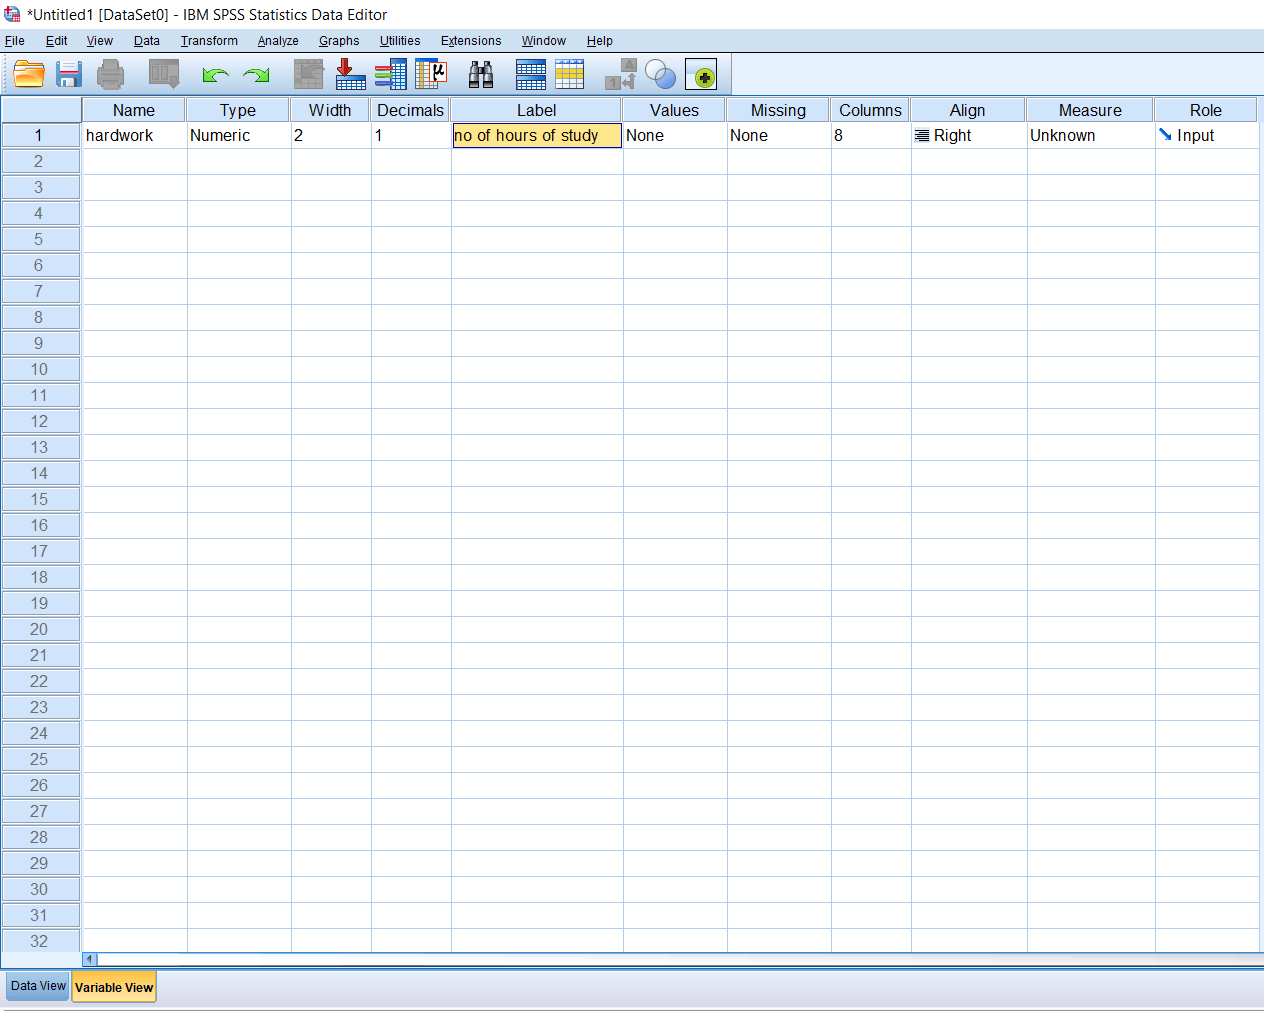
So, these are the certain conventions while defining the variable name in SPSS. We should keep the variable name short while defining the variable in SPSS. If we want to write a descriptor for the variable name, we can use the label option. For example, for hardwork, we can write it as no of hours of study. We can write a full story in the label, and that will be acted like a descriptor.
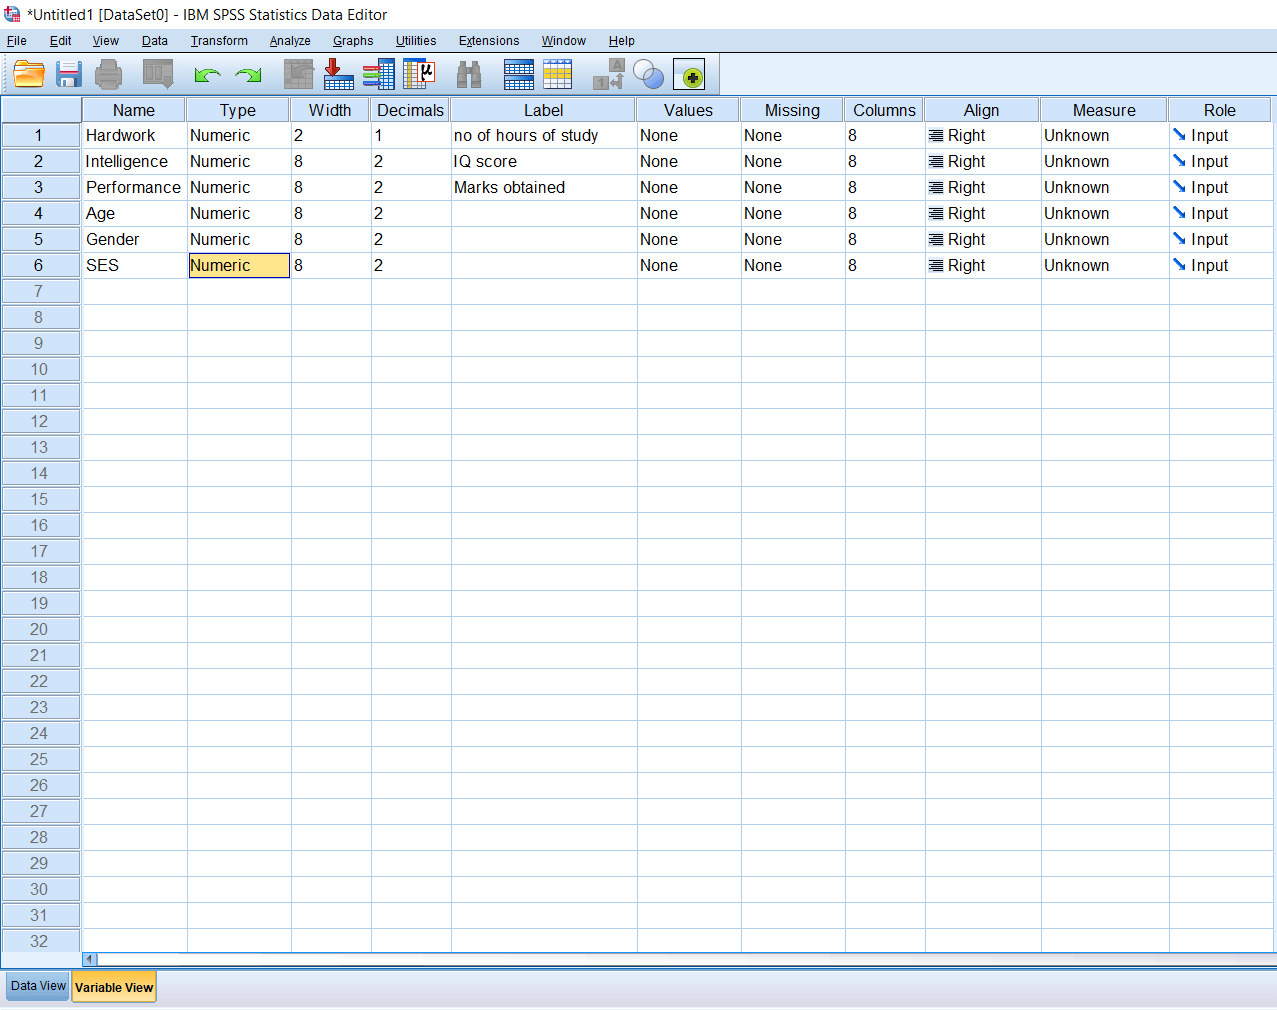
Now we are going to add some research variables like Intelligence, Performance. Where Intelligence is measured as an IQ score, and Performance is measured as a Marks obtained. Apart from them, we have some demographic variables like Age, Gender, SES (socioeconomic status) like this:
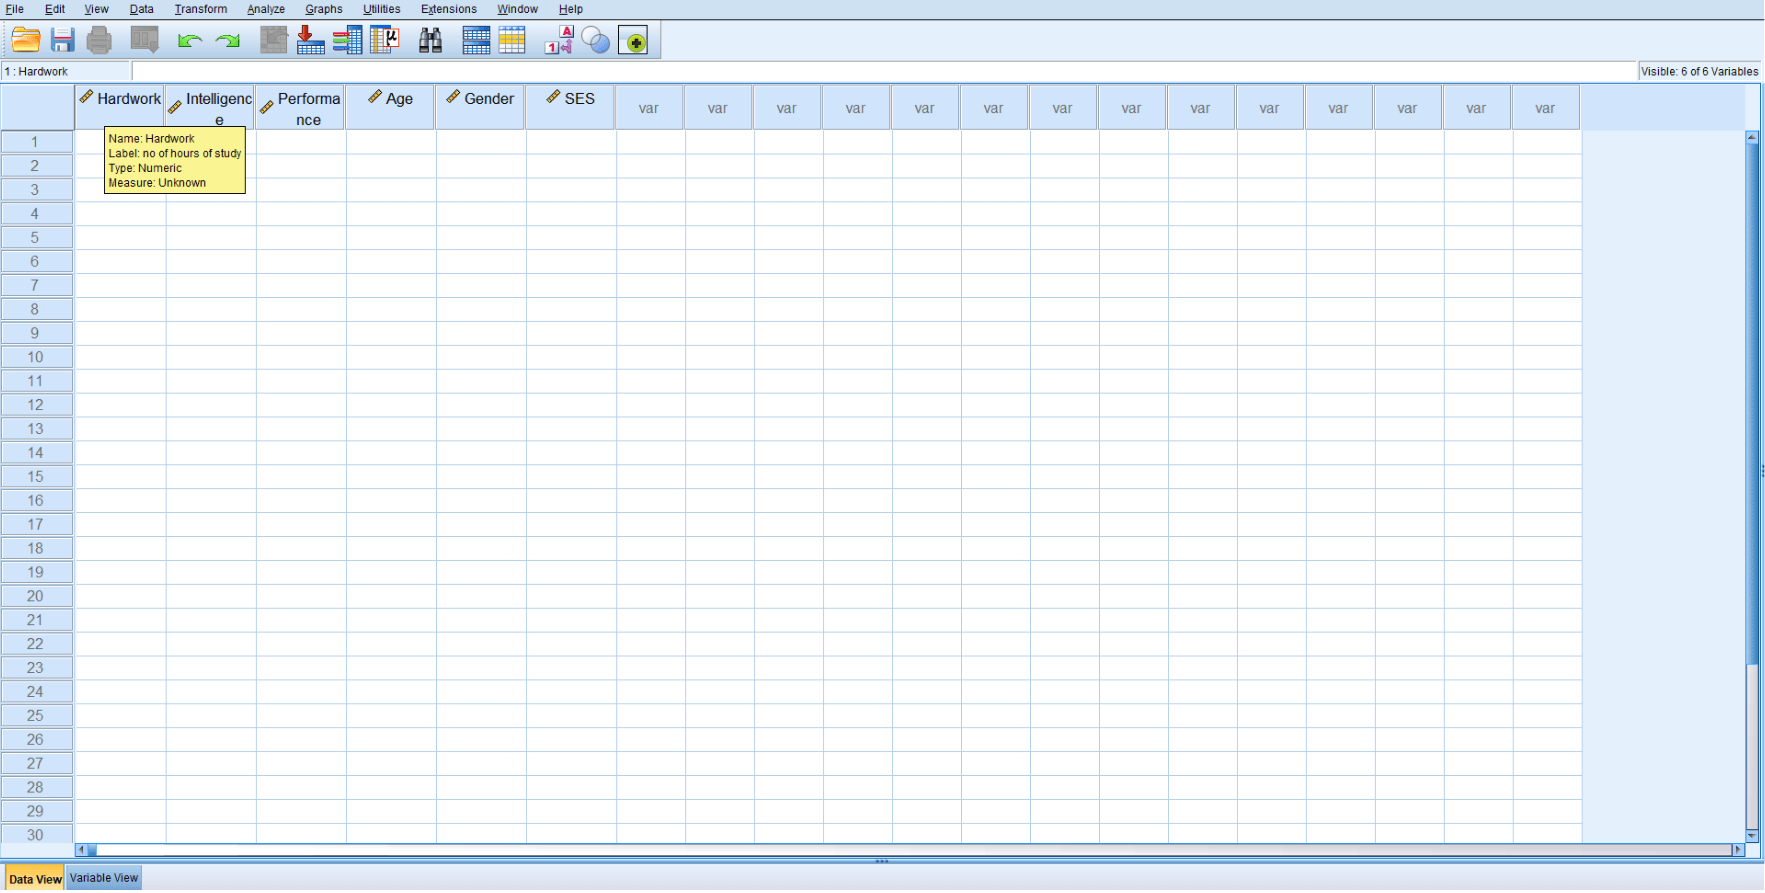
When we click on the data view option, we can see all the variables. The importance of writing the labels is that when we put the mouse cursor on variable names, we can see the description of those variables. This description helps us to understand our variable when we have a large data set. We can quickly place our cursor on the variable name and understand what kind of variable it is.
So that's how we can define our variable in SPSS.
Comma and Dot Variable in SPSS
In this section, we are going to learn about the comma variable and dot variable. Comma and dot are the two variable types, which are a type of delimiters used in SPSS.
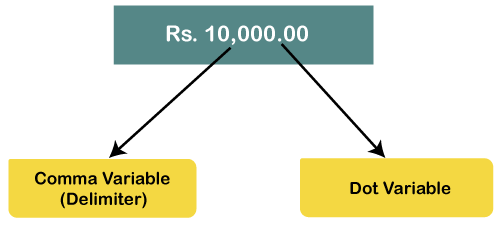
They are less often used because we don't understand them, or we don't want to specify all variables properly, but it is good to know about them. Firstly we will define the delimiters. So delimiters are the notation or the symbols, which are used to specify the boundary between digits. For example, suppose we want to write ten thousand rupees, how we write it. We will write it as 10000, but at best, what we can do to make it more readable or better. We can put a comma like 10,000. If we put a comma between 10,000, the comma is acting as a delimiter. Generally, we put comma as a delimiter, and then for decimal values, we use a dot like 10,000.00.
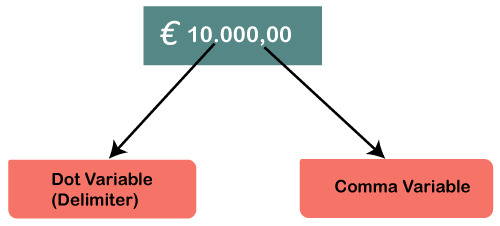
So this is the one standard kind of notation we generally follow mostly in India or US, but in many other countries, this convention is not followed in fact, it is reversed. If we are in Europe and want to write ten thousand euros, we can write it like 10.000,00. Here dot acts as a delimiter.
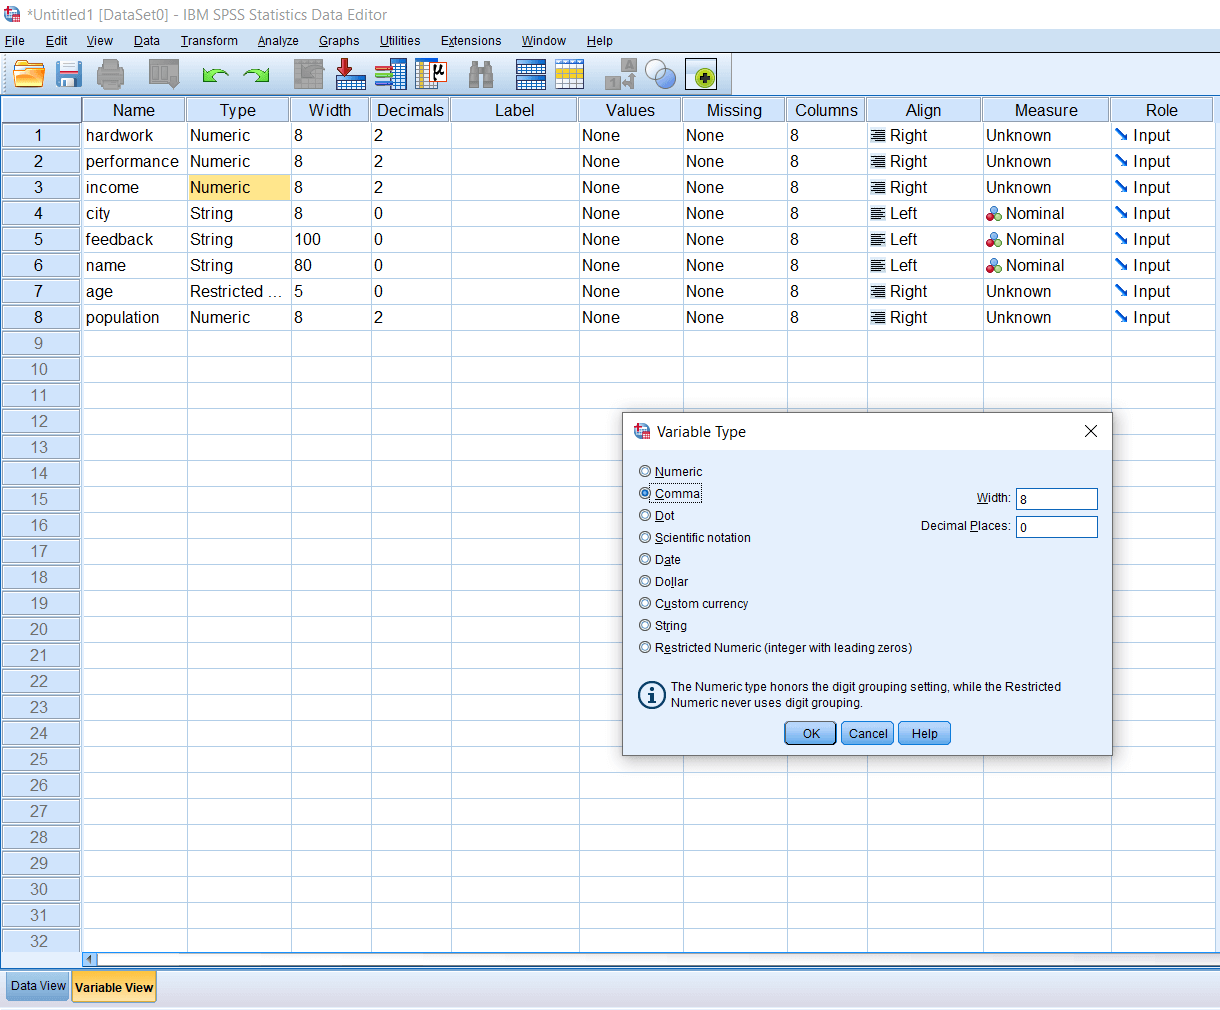
Now we are going on SPSS, and let's try to define comma and dot variable types. Suppose we will define one case as a comma separator delimiter and other cases as a dot separator delimiter. Let's have two different types of variables, like income and population. We will define income as a comma separator variable and population as a dot separator delimiter. So, firstly we will define income as a comma separator delimiter. For this, we will go to Numeric type of income variable then click on comma and then press ok like this:
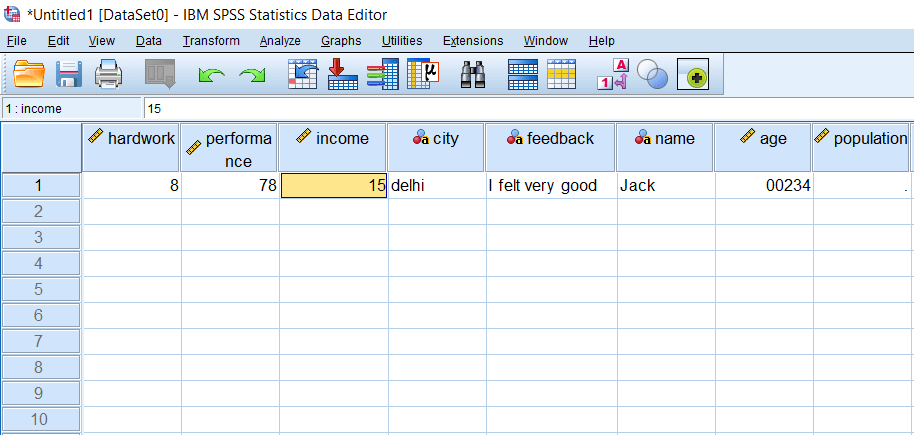
When we click on the data view option, we will see nothing in the income field because our value is 15, which is very small.
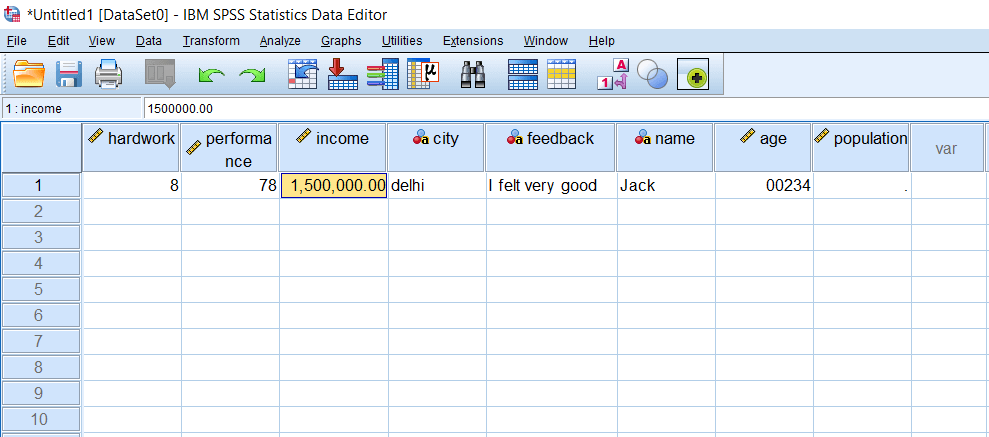
Suppose we are writing fifteen lakhs, and once we press enter, we will see comma as a delimiter like 1,500,000. If we want to add decimals, we can also define it. For this, go to the decimal option and define it upto 2 places. This dot separates our value after the decimal. Now the value of income will look like this:
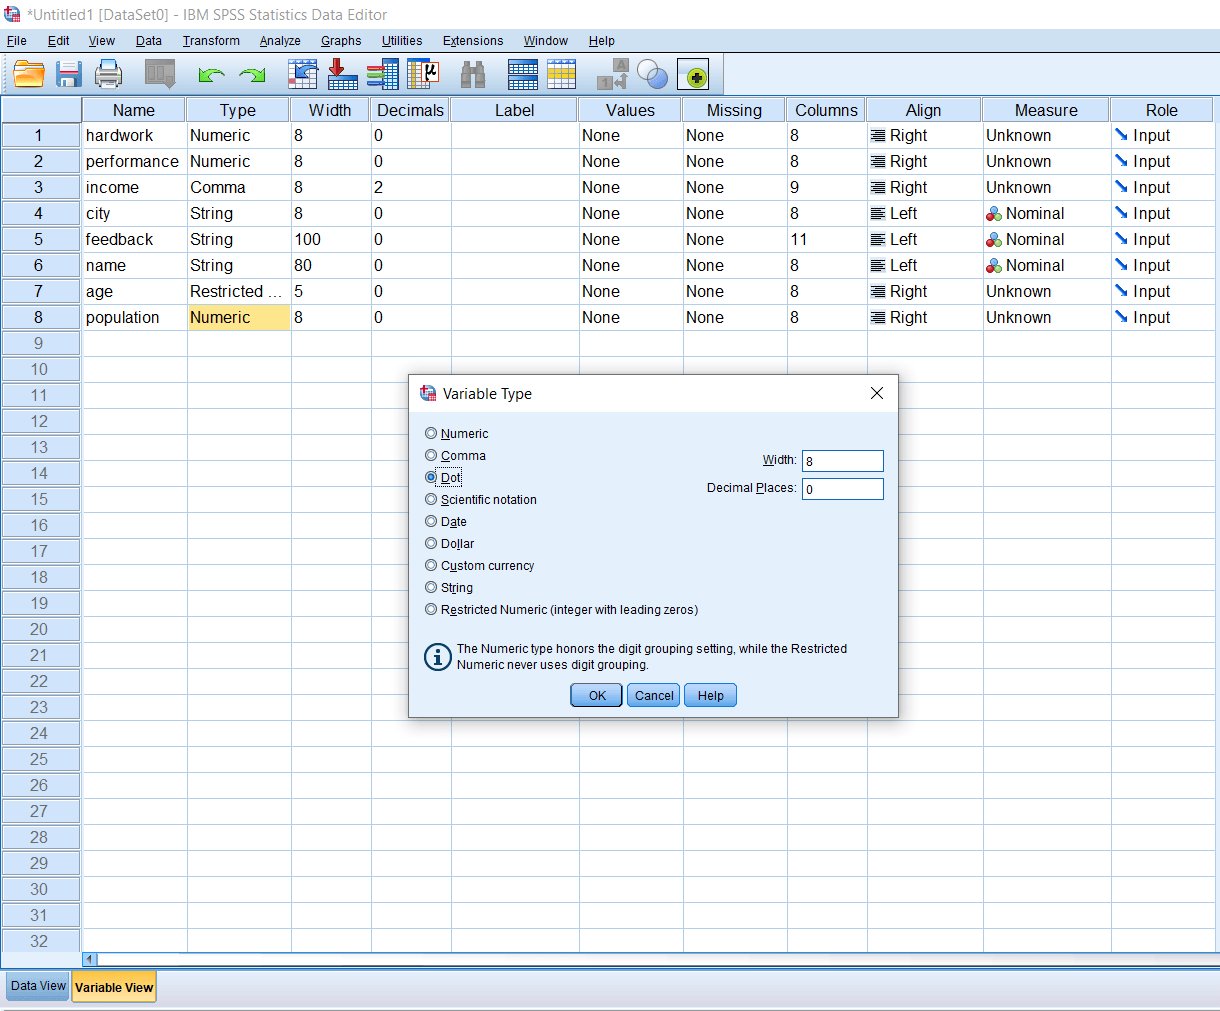
Now we will define the population as a dot separator variable. For this, we will go to Numeric type of population variable then click on the dot and then press ok like this:
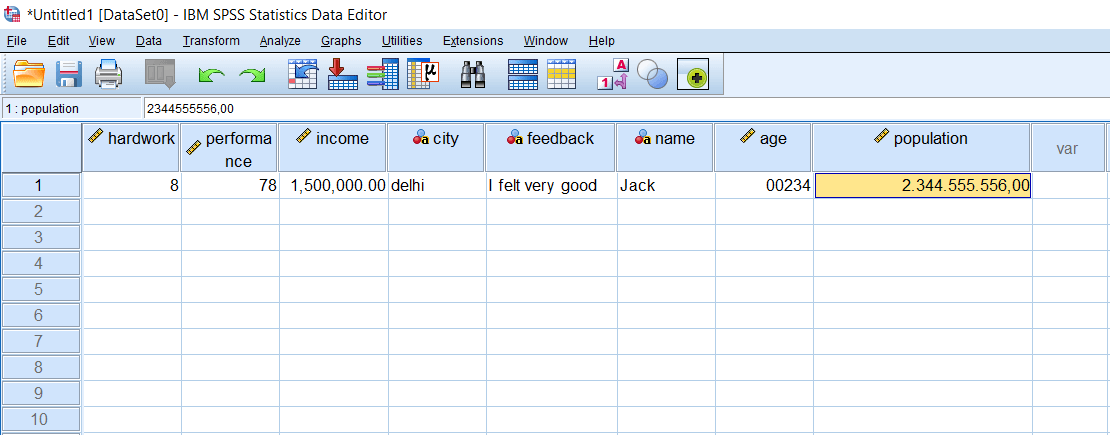
Now we will enter the population of delhi city. Suppose the population of delhi is something random value like 2344555556. After this, we will press enter. Since we have taken dot as a delimiter, so we are expecting the digits to be separated or boundary to be created by using the dot variable. So after press enter, the value will look like 2.344.555.556,00. So the boundary is created by the dot variable, and a comma separates the decimal value.
But in India, we are not accustomed to such type of value because we generally use a comma as a delimiter.


No comments:
Post a Comment