Anyone who has seen the movie “Lion” understands the importance Google Earth can play in someone’s life. The 2016 Oscar-nominated film is based on the true story of Saroo Brierley’s search for his family, from whom he was separated in India at age 5.
Brierley (played by Dev Patel) uses Google Earth to find locations he remembered as a small child, dropping pins on the map to mark those places. He then drew a radius of how far away he may have traveled after boarding a train as a child and wound up in Calcutta.
The movie used Earth to weave the tapestry of Brierley’s story, much in the same way we use it as journalists. And we can train future journalists to use these tools to tell stories just as impactful as Brierley’s.
When teaching Google tools to my journalism students at University of Illinois-Chicago or the University of Notre Dame, or in my SPJ/Google News Lab trainings, I always stress how the tools can be used to answer fundamental questions journalists ask – who, what, when, where, why, how and how much. Specifically, Google Earth tools do a great job of addressing the “where” question.
Google Earth offers many different types of tools, and I focus on three in my trainings: Google Earth Pro, Google Earth Engine Timelapse and Google Earth for Chrome. We’ll explore each tool and discuss ways you can implement it into your multimedia and even data journalism courses.
Getting Started
First, I introduce students to Google’s Geomedia page, which features resources for several tools, ranging from Fusion Tables and MyMaps to the Earth products. I also ask the students to follow the @googleearth and @googlenewslab Twitter accounts, as both offer great examples of how to use Earth on breaking and long-term projects.
I also talk about Google’s permissions policy for using images and video with Earth products. Google requires them to include the Google or Google Earth watermark on all photos/videos, per Google’s policy. If the watermark is cropped out for some reason, they have to include Google attribution as a photo credit or mention it in the cutline, per Google.
Once we finish with the basics, I start them on using the three tools, starting with…
Google Earth Engine Timelapse
Timelapse is one of the easiest to learn and embed, and it’s great for getting students in an introductory multimedia class – or even a lower-level reporting course – thinking about data, geolocation and change.
Timelapse is a global, zoomable video that lets you see how the Earth has changed over the from 1984 to 2016. The mosaics are interactively explorable through Carnegie Mellon University CREATE Lab’s Time Machine library. It’s great at showing how a city has grown/expanded over a period of time, and how that may or may not have impacted the environment around it.
It also features environmental changes in remote or rural areas, such as the glaciers melting, which CNN has featured during interviews and stories on global warming.
At the bottom of the interface, Google has provided a series of interesting locations in Timelapse, including the one below of Las Vegas. It’s easy to see how Vegas has grown over the years, but ask the students how that has impacted the environment around it. (HINT: Watch the lake on the right.)

Google Earth Engine Timelapse: https://earthengine.google.com/timelapse/
Then I use the search field in the upper left corner to find Dubai or the Hong Kong airport, showing how they spring up from the water. I also have the students shout out various locations (hometowns, buildings, addresses, etc.) and we watch how those areas have changed.
Then I give the students a short take-home assignment: Use some data to write a short piece about a locations that is undergoing growth or change. Then they must use Earth Engine to illustrate that change at the location. It’s a popular, fun assignment that produces some interesting results. I’ve posted several projects that my Notre Dame students did here and from my UIC students here. (Timelapses appear lower on both pages so you’ll need to scroll.)
It’s interesting to see how the students think globally on this assignment while others locally, focusing on what they’re familiar with. Regardless, the assignment is a very low-tech way to get students thinking about changes to the environment and thinking about location.
Note: To embed the timelapse viewer on your site, use the “Share or embed” button in the lower right corner of you post. Just make sure you have zoomed in to the area you want to showcase. You can also create a timelapse tour that moves from one destination to another over time using the Timelapse Tour Editor.
Google Earth for Chrome
Once students are comfortable with Timelapse, I spend a little time showing them some of the new storytelling features in Google Earth for Chrome. Google Earth also has updated its mobile app with these features.
Earth has incorporated Google search’s “I’m Feeling Lucky” tab on the left toolbar, which guides you to random (but interesting) places. As you arrive at the location, Google’s Knowledge Graph appears in the upper-right corner with facts about the location. I also show students Earth’s new Voyager feature, where Google teams with various organizations to tell visual stories in a whole new way.

Google Earth for Chrome’s Voyager button features new ways to tell stories visually. Great examples to inspire students.
I also drag the small “Street View Icon” in the lower right corner to show the students how to view 360 images of a location. I have them skip around to various places (home, attractions, famous buildings). This also is a good opportunity to discuss ethics and privacy, as Google Earth blurs out licenses plates and faces of some people who appear in Street View images.
I also stress how to use Street View for fact-checking locations, something you also can do with the historical imagery tool in Google Earth Pro (more on that below). To start, I have the students shout out locations of various places to visit, just to show them how it works.
Then I take them to a Street View level of Pulse Nightclub in Orlando, Florida, site of the mass shooting. Then I show them locations of other Pulse Nightclubs around the country (Philadelphia, etc.) and remind them how easy it is to confuse locations that have the same name but are actually in different cities. (Hint: Typing in Memorial Stadium may take you to Lincoln, Nebraska, or Champaign, Illinois, or Bloomington, Indiana, among others.)
For a take-home assignment, I give them a series of photos with a cutline or tweet describing it, along with coordinates or addresses of locations. The student must then fact-check the photo and write whether they would publish/retweet/share the photo based on the information given.
For instance, I give them a photo of a location in Kabul, where a bombing supposedly happened. But the photo is actually from a news story in Afghanistan earlier. By searching the coordinates or address, they can use Street View to fact-check if the location is accurate.
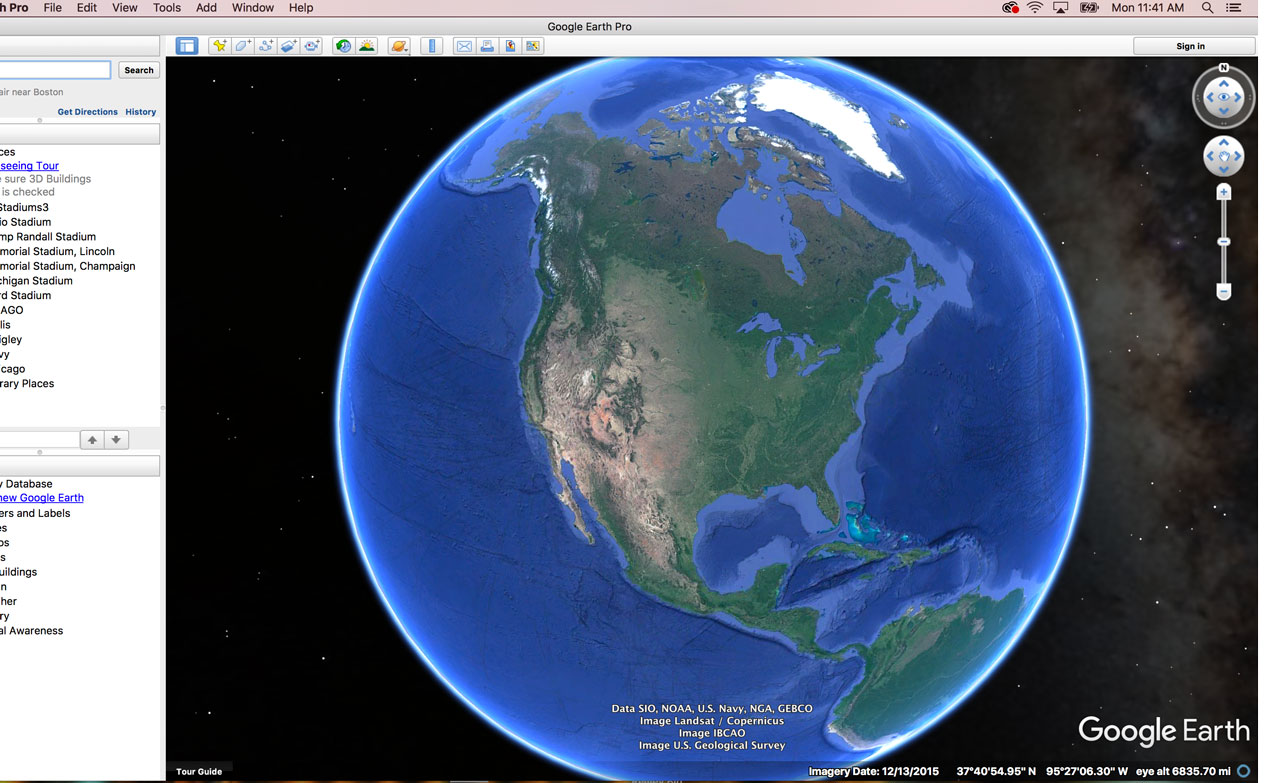
Google Earth Pro
Google Earth Pro has many uses, and we’ll touch on a few in this section. Once students download the tool to their laptop hard drive, they should open the software and hover over the tools at the top of the page. Each button’s purpose is highlighted: Record a Tour, Historical Imagery, Save Image, etc.
The tool has a search feature in the upper left corner where you can type in addresses, names of locations or coordinates. Be sure to double-check the Knowledge Graph that appears underneath the search box to confirm the location you typed in is accurate.

Students can use Google Earth Pro to design 3D renderings, flyovers and video tours. (Credit: Google)
I show students how to use the historical imagery tool that allows them to find older satellite and Street View images of locations. This can be helpful for showing before/after photos of a location after construction, fire or other news event. I also show them how to load the before/after photos in a slider tool such as Juxtapose JS .
A good example of a before/after satellite shot is this one my Notre Dame students produced showing the construction changes to Notre Dame Stadium. Lower on the page, they used the satellite view in Google MyMaps to feature specific additions to the stadium.
Using the tools in the lower left corner of the interface, students can add features such as 3D building renderings, roads, weather, labels for locations, etc. The 3D renderings are great for producing zoom-ins, tours and flyover videos using the movie maker tool built into Earth Pro. Once they choose their locations and record, the movie maker tool exports it as an .mp4 or .m4v file.
I recommend showing this six-minute video to the students that walks them through the steps, either in-class or as a homework assignment before your Google Earth Pro lab. During class, I walk them through the steps to build and export the tour again.
For a take-home assignment, I ask the students to create a tour or flyover that tells a story about change or serves as a guide for readers. Some chose to do stories on campus, but many reached far beyond the state’s borders.
When evaluating the work, I look at creativity, storytelling, accuracy, production quality and the short article or explanation required with the assignment. Fundamentals matter. Misspelling the name of the location dings the grade, same as any other assignment, no matter how good the tour is.
Student Work
Notre Dame data journalism student Caelin Miltko created a tour showing the migration of Irish immigrants to her hometown of Butte, Montana. Teagan Dillon focused on a tour of stadiums that Notre Dame football plays in during the “Shamrock Series.” She used Adobe Premiere to add the lower-thirds at the bottom of the video after it was exported from Earth Pro.
One of my UIC students, Stephen Ruiz, used Earth Pro to create a tour of great concert venues around the country.
I do a similar exercise in my Google News Lab trainings in newsrooms. For some, I have them create a tour of Big Ten football stadiums listed at the bottom of this page. In Montana, we practiced with tours of the state parks. In Tennessee, we toured SEC football stadiums. In Washington D.C., we toured the landmarks. In Chicago, we did a flyover of downtown buildings and sightseeing attractions.
Mike Reilley is an SPJ/Google News Lab trainer who also teaches part-time at the University of Illinois-Chicago and the University of Notre Dame’s Gallivan Program. He’s the founder and editor of The Journalist’s Toolbox. His student project have earned recognition from ONA’s OJA awards, Editor & Publisher EPPY awards, SPJ Mark of Excellence and ACP Pacemakers. To schedule a free training with Mike, visit SPJ/Google News Lab and email him at mikereilley1 [at] gmail. Follow him on Twitter at @journtoolbox.
