STORE INTELLIGENCE · STEPHANIE CHAN · MARCH 2021
The Median Price of In-App Purchases Has Grown 50% Since 2017 on iOS
The median price of IAPs in top U.S. App Store apps grew from $3.99 to $5.99 between 2017 to 2020, Sensor Tower data reveals.

Global consumer spending in mobile apps reached unprecedented levels in 2020, climbing 30 percent year-over-year to $111 billion. Alongside this increased spending, the price of in-app purchases (IAP) has also reached a new high. According to an analysis of Sensor Tower Store Intelligence data, the median IAP price among top apps on Apple's App Store in the United States has grown 50 percent since 2017.
For this analysis, we studied one-time purchases as well as subscriptions among the top 20,000 most downloaded apps on the U.S. App Store between 2017 to 2020. We found that IAPs among the top non-game apps reached a median price of $5.99 in 2020, 1.5 times the median of $3.99 in 2017. This increase in price may correspond with a growing consumer comfort with paying for premium content, particularly in a year when many users were turning to mobile devices for entertainment, work, and education. On the other hand, the median price of subscription IAPs among these apps remained flat at $9.99 across the past four years. The consistent price point might speak to how competitive the space is and consumer expectations for services with recurring fees being priced around or under $10 monthly.
Shifting Towards Subscriptions—and Staying There
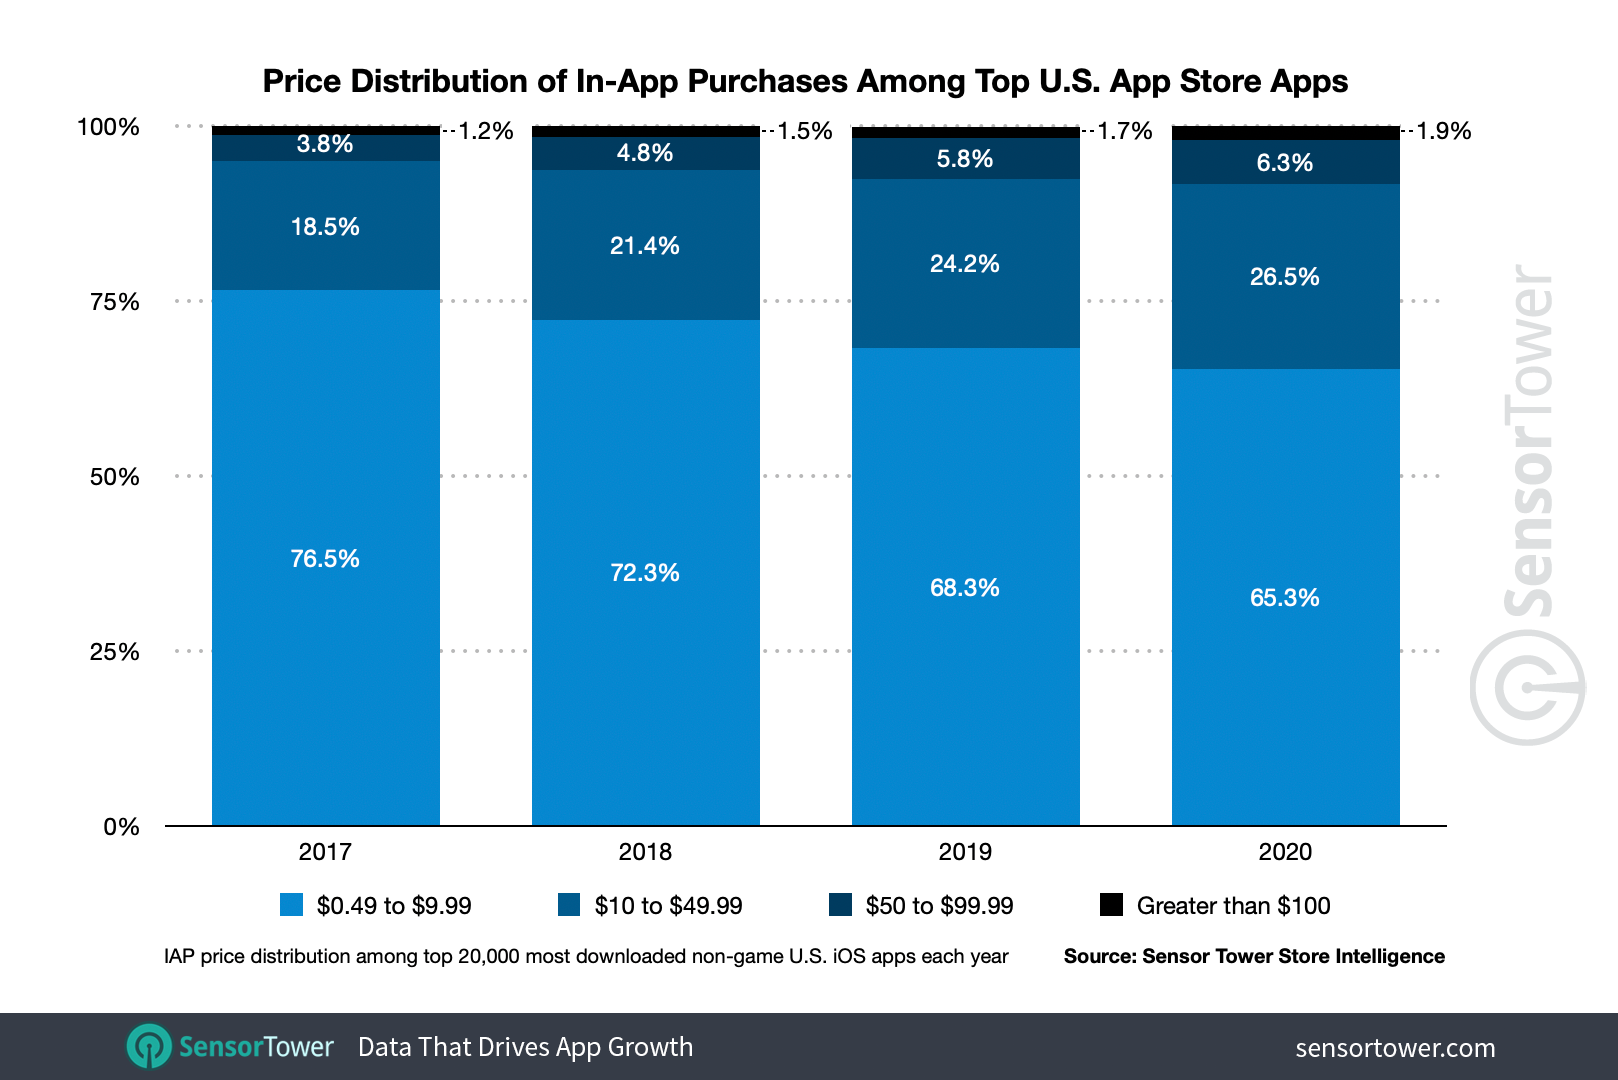
The majority of IAPs in the non-game apps we studied, 65 percent, were still priced below $10 in 2020, but the next tier—$10 to $49.99—has been gaining ground over the past four years. This tier represented about 19 percent of IAPs in 2017, while its share has grown to 26 percent as of 2020. The Photo & Video and Health & Fitness categories contributed the most to the increase in IAPs priced in the $10 to $49.99 range, likely due to these categories seeing a surge in the amount of subscription IAP offered.

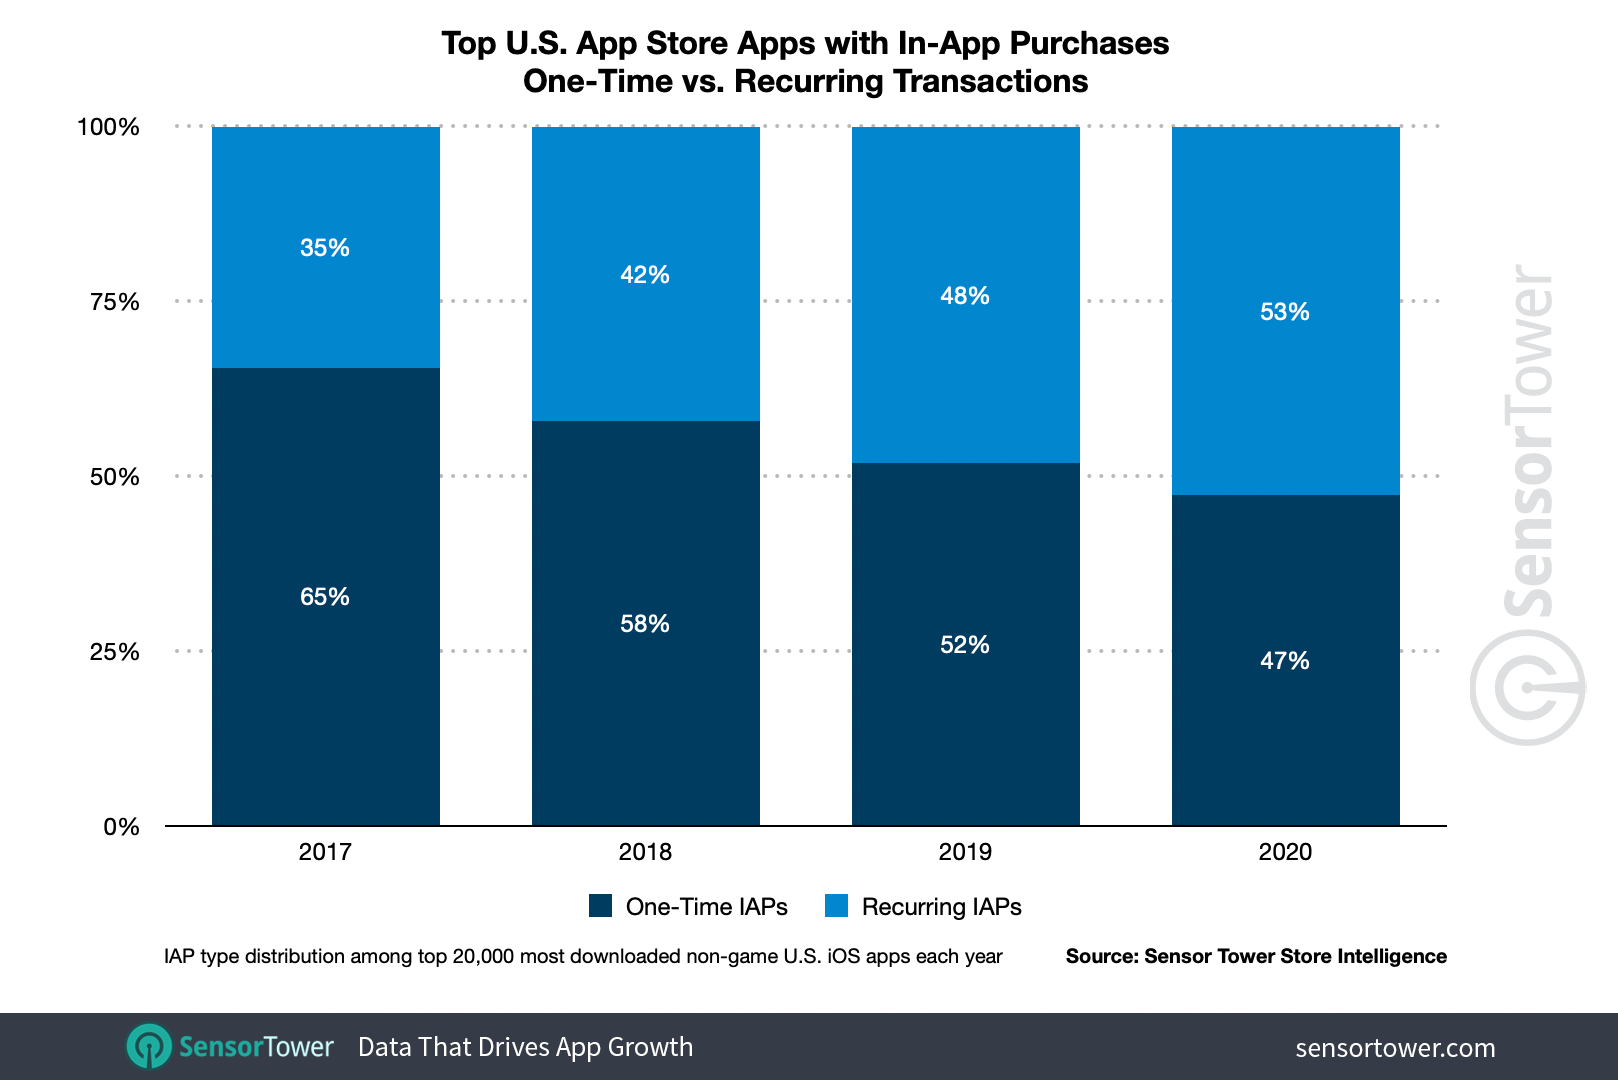
U.S. consumers have shown a healthy appetite for subscriptions, spending $10.3 billion in the top 100 subscription apps in 2020. In this analysis we found that the majority of apps studied that include IAPs now offer subscriptions rather than only one-time purchases, with popular apps such as AccuWeather and Ookla's Speedtest adopting the model last year.

For the first time ever, approximately 53 percent of the apps studied that include IAPs now offer subscriptions. Furthermore, among the apps that included IAPs from 2017 to present, about 16 percent replaced one-time purchases with subscriptions outright. Conversely, 73 percent of the apps that contained subscriptions in 2017 continued to offer them in 2020.
Photo & Video Subscriptions Are on the Rise
Top apps in the Photo & Video category have seen the greatest increase in subscriptions since 2017, when 74 percent of IAPs in the category were one-time purchases. By 2020, the percentage of subscription IAPs among these apps had grown 28 points to 54 percent.
Food & Drink and Weather have also witnessed a surge in subscription IAPs. In 2017, 23 percent of the top Food & Drink apps with IAPs offered subscriptions, a figure that grew to 47 percent in 2020. Over that same period, top Weather apps with IAPs saw their percentage with subscriptions grow from 36 percent to 60 percent.
Top apps in the Health & Fitness category also saw a healthy uptick in subscriptions as compared to one-time IAPs. In 2017, about 52 percent of such apps with IAPs offered subscriptions. This grew to 73 percent in 2020.
The uptick in subscription IAPs in Photo & Video category apps may correspond with user interest in video-centric social media platforms such as TikTok, which had a record-breaking year. Two of the top-downloaded apps with subscriptions in this category were PicsArt and InShot, both video editors.
In the midst of COVID-19, consumers were also turning to mobile apps to replace activities such as going to restaurants and gyms, which may explain why the Food & Drink and Health & Fitness categories also saw a surge in subscription IAP. Developers may have offered more subscriptions to capitalize on the influx of new users seeking recipes, guided workouts, and more.
In-App Purchases in Mobile Games
The median price of IAPs in the top U.S. iOS games saw a slight uptick in 2020 after remaining flat between 2017 and 2019. Among the top 20,000 most downloaded games on the U.S. App Store, the median IAP price climbed 25 percent from $3.99 in 2019 to $4.99 last year. Unlike among non-game apps, the median subscription price in games also increased about 17 percent Y/Y from $5.99 to $6.99.
As consumers turned to mobile games for entertainment during the COVID-19 pandemic, player spending on mobile games reached new heights in 2020, including in the U.S., which ranked No. 1 for revenue. Publishers may have responded to this surge in interest by increasing the price of IAPs, especially if their research showed players were willing to spend more in emerging high-ARPDAU genres such as Squad RPG.
The majority of purchases in games remained below $10. In 2017, 80 percent were priced below $10, and in 2020 that figure grew to 81 percent.

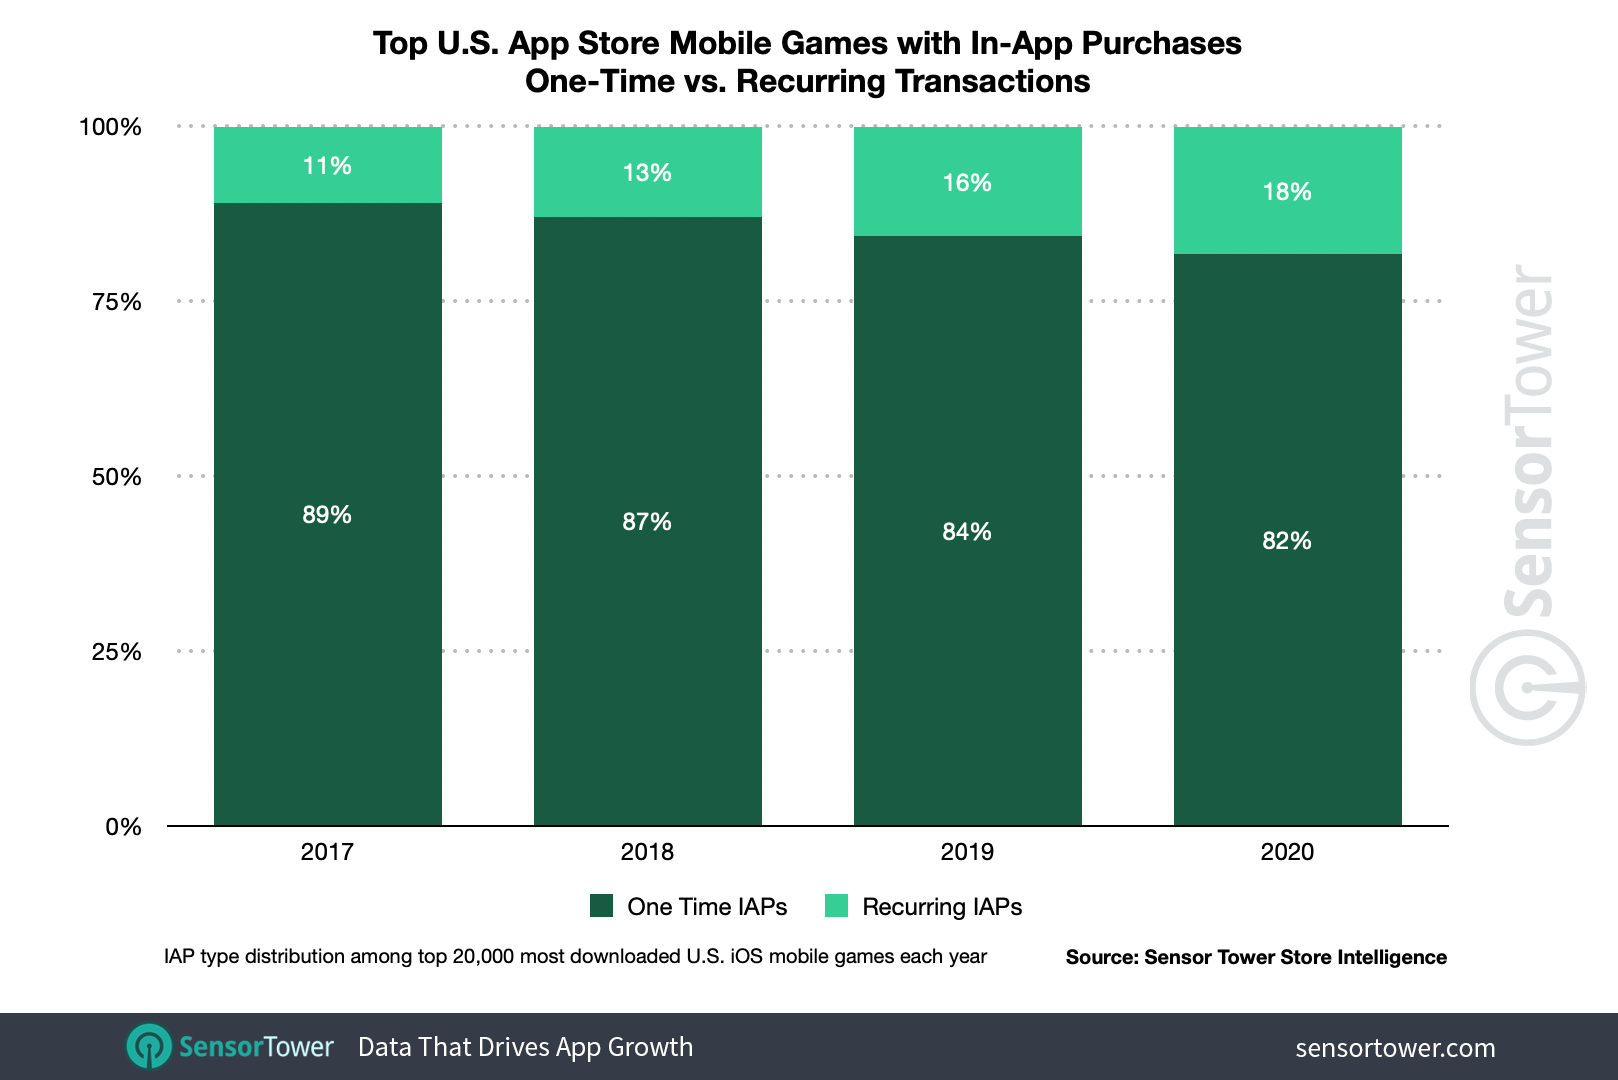
As within non-game apps, however, mobile games are also seeing increased adoption of the subscription model. While the majority of games don't yet offer subscriptions, the number with them has grown. Of games in our sample with IAP, 11 percent offered subscriptions in 2017. As of 2020, that share had grown to about 18 percent as titles such as My Talking Tom 2 and Yahtzee with Buddies Dice adopted the model.
As Subscriptions Gain Momentum, Platforms Police Exploitation
Sensor Tower's latest five-year mobile market forecast revealed that global consumer spending on Apple's App Store will grow to $185 billion annually in 2025. Developers have had to adapt to evolving user behavior due to the COVID-19 pandemic, but the marketplaces themselves have made adjustments as well to address emerging trends and needs.
Most recently, Apple reportedly started rejecting in-app purchases with prices that it deemed "irrationally high" from the App Store, signalling that it may be more closely scrutinizing the appropriateness of IAP pricing in context with value delivered. This is the latest sign that, as the mobile ecosystem continues to grow and evolve, so too will the platforms themselves, rolling out new policies or more proactively enforcing existing ones.


